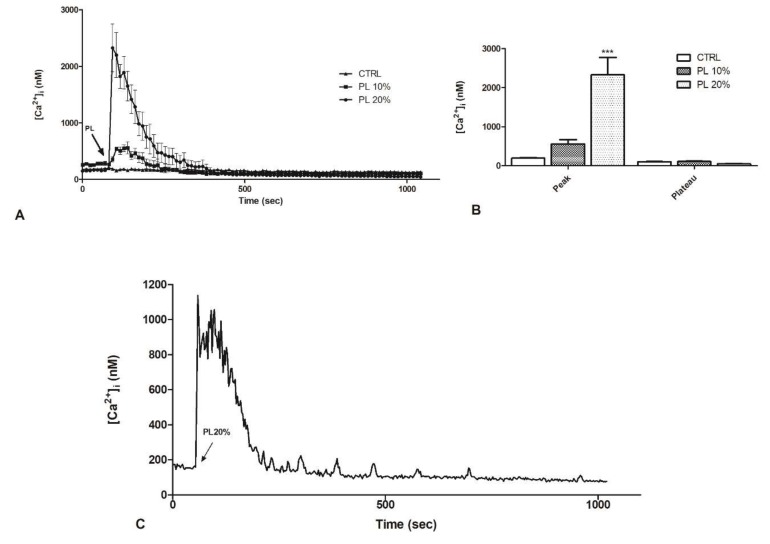
Figure 2.
PL induces a dose-dependent increase in intracellular Ca2+ concentration in bEND5 cells. (A) [Ca2+]i variations recorded at 10 s intervals, showing no variations in control conditions (CTRL, i.e., cells incubated in confocal microscopy loading buffer, as described in Materials and Methods section), and distinct patterns of Ca2+ signaling after exposure to 10% and 20% PL. Data are means ± s.e.m. of [Ca2+]i traces recorded in different cells. Number of cells: CTRL: 20 cells from 2 experiments; 10% PL: 40 cells from 3 experiments; 20% PL: 40 cells from 3 experiments. (B) Mean ± s.e.m. of the peak Ca2+ response induced by treatment with 10% or 20% PL. Number of cells: CTRL: 20 cells from 2 experiments; 10% PL: 40 cells from 3 experiments; 20% PL: 40 cells from 3 experiments. Asterisks on bars indicate statistical differences determined by two-way ANOVA with Bonferroni’s correction (p < 0.001). C. [Ca2+]i variations recorded at 1 s intervals induced by 20% PL. Data are means ± s.e.m. of [Ca2+]i traces recorded in 40 different cells.

