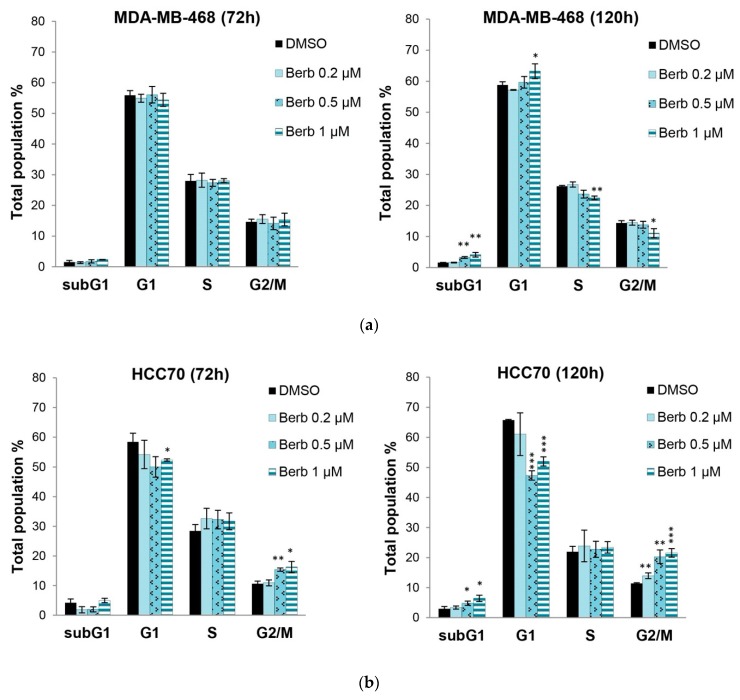
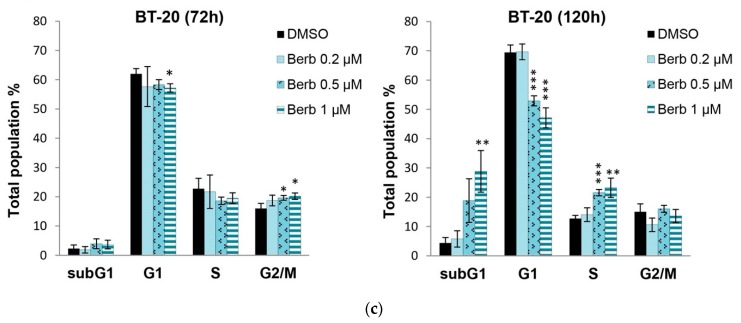
Figure 3.
Berberine’s effects on TNBC cell cycle progression depending on its doses (µM) 0.2, 0.5 and 1, and time for 72 h and 120 h. Total population % of cell cycle phases (G1, S, G2/M and SubG1) ± SD of three independent experiments, * p < 0.05, ** p < 0.01 and *** p < 0.001 compared to DMSO. (a) MDA-MB-468, (b) HCC70 and (c) BT-20. Berb—Berberine.


