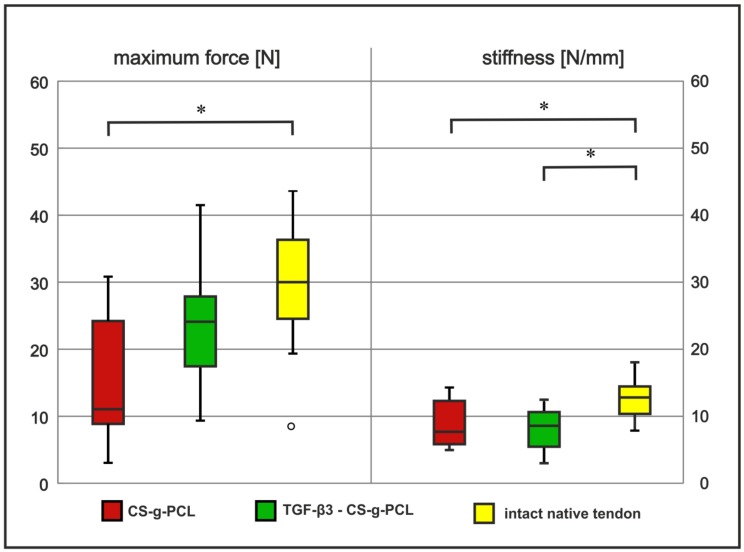
Figure 2.
Differences in median values of maximum forces (load to failure; left columns) and in stiffness (right columns) are shown for groups with refixed tendons (with CS–g–PCL scaffold [red bars] and TGF–β3–CS–g–PCL scaffold [green bars]) compared to the intact native tendon [yellow bars]. Significant differences (significance level of α = 0.05) are marked with asterisk (*).

