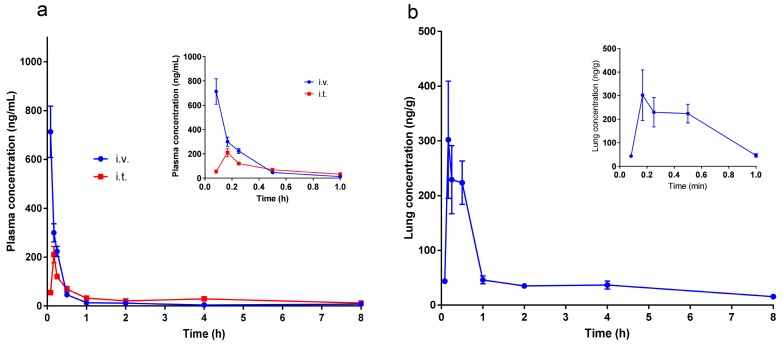
Figure 8.
(a) Plasmatic pharmacokinetic profile of naringenin inclusion of i.v. and i.t. administration, inset was the magnification of the profile within 0.083~1 h; (b) pulmonary pharmacokinetic profile of naringenin inclusion of i.t. administration, inset was the magnification of the profile within 0.083~1 h (mean ± SEM, n = 6).

