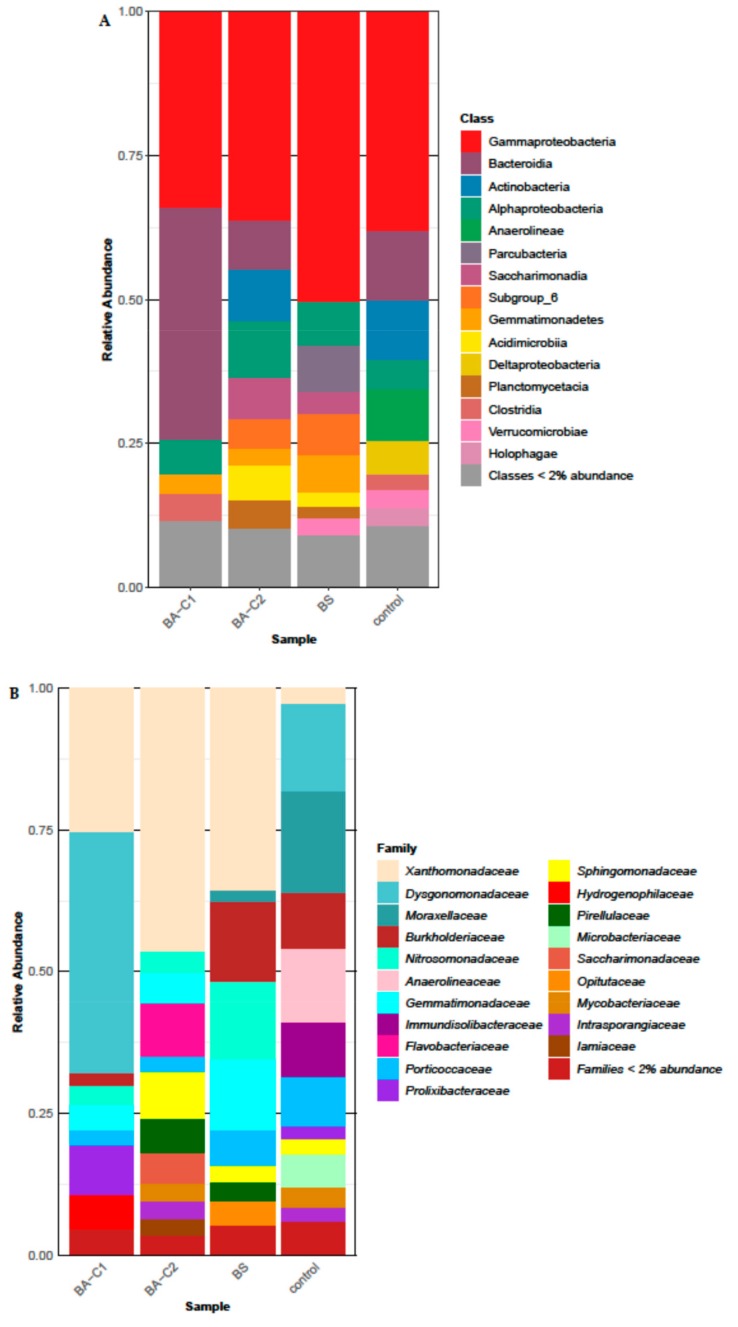
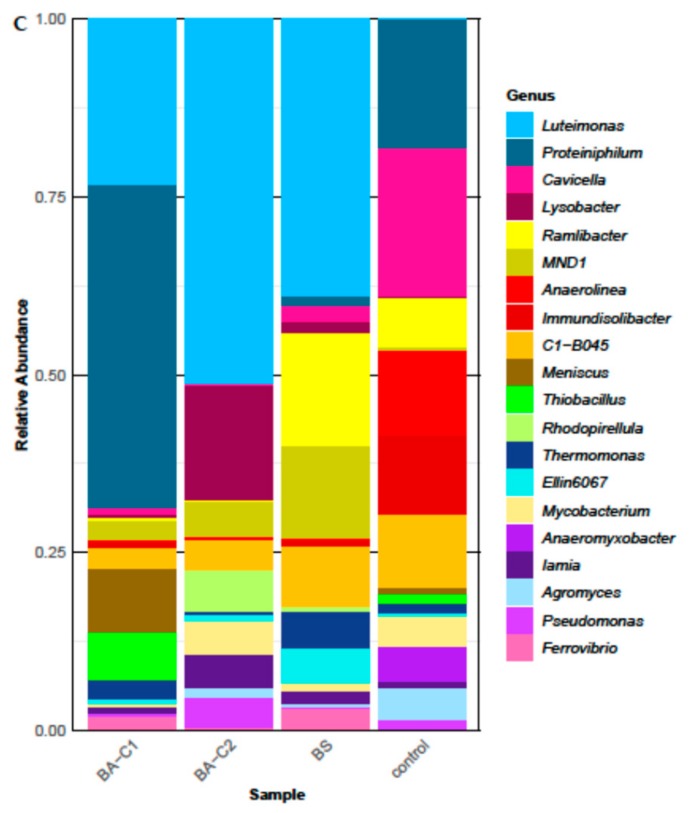
Figure 3.
Soil bacterial community structure at the (A) class and (B) family level after 60-day bioremediation treatments. (C) Twenty of the most abundant genera in the analyzed communities. Please note that the sum of the relative abundances (100%) shown here refers only to the most abundant genera for better visualization of the results. The real values are presented in Section 2.4. Control: untreated microcosms, BS: biostimulated microcosms, BA-C1 and BA-C2: microcosms bioaugmented with the community C1 and the mixed culture C2, respectively.


