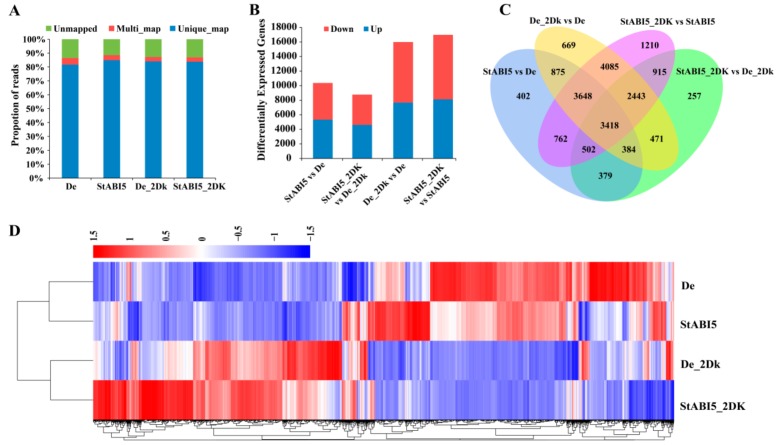
Figure 4.
Analysis of differentially expressed genes. (A) Proportions of clean reads that were unmapped, mapped to multiple genes, and mapped to unique genes, which were plotted by three replicates of De, StABI5, De_2DK, and StABI5_2DK, respectively. (B) Statistical analysis of differentially expressed genes between different samples. (C) Analysis of the overlap of differentially expressed genes between different comparison combinations by Venn diagram. (D) Cluster analysis of differentially expressed genes by heat map. Red represents high gene abundance, blue represents low gene abundance.

