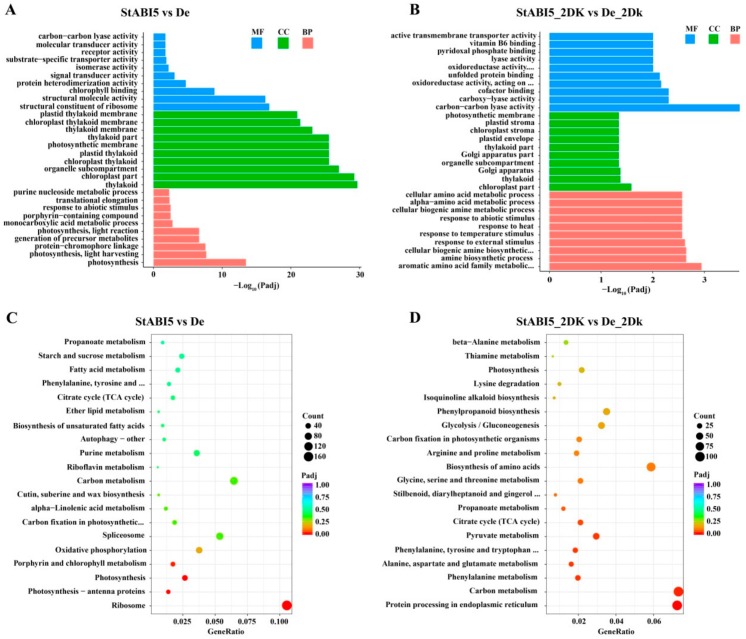
Figure 5.
Gene ontology (GO) and KEGG pathway enrichment analysis of differentially expressed genes (DEGs). (A) The top 30 most enriched GO terms found in the analysis of DEGs in StABI5 vs. De group. Different colors represent molecular functions (MF), cellular components (CC), and biological processes (BP). Gene ontologies were ranked by their significance. (B) The top 30 most enriched GO terms found in the analysis of DEGs in StABI5_2DK vs. De_2Dk group. (C) The top 20 functionally enriched KEGG pathways found in the analysis of DEGs in StABI5 vs. De group. (D) The top 20 functionally enriched KEGG pathways found in the analysis of DEGs in StABI5_2DK vs. De_2Dk group.

