Figure 3.
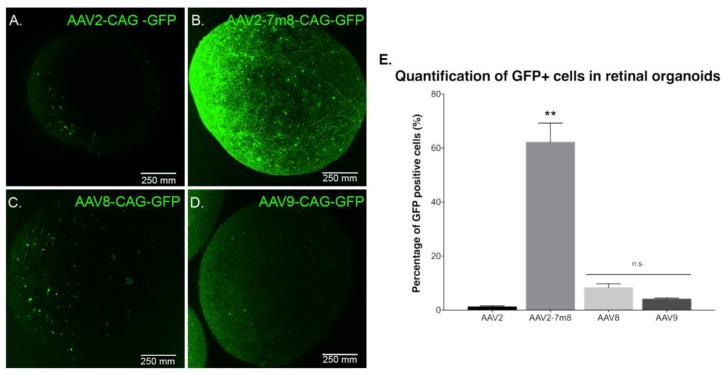
GFP expression as a function of the serotype. Live confocal imaging of representative retinal organoids showing GFP Expression driven by the CAG promoter for the four different tested capsids. (A) AAV2-CAG-GFP. (B) AAV2-7m8-CAG-GFP. (C) AAV8-CAG-GFP and (D) AAV9-CAG-GFP. In all cases, the infections were performed at a viral concentration of 5 × 10¹⁰ vg per organoid at day 44 of differentiation. Scale bar: 250 µm. (E) Percentage of GFP positive cells quantified by FACS analysis. N = 3 biological replicates of n = 10 organoids. Values are mean ± SEM. For statistical significance, Mann–Whitney Student’s test was used and ** p < 0.05 was considered significant. n.s. = non significant.

