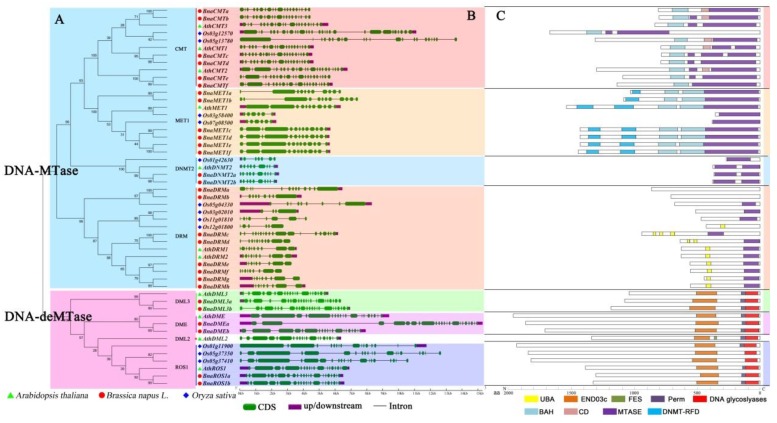
Figure 1.
Evolutionary relationship, gene structure, and protein domain analysis of rapeseed DNA-MTase and DNA-deMTase gene families. (A): Family phylogenetic tree analysis. The evolutionary distances were computed using the Poisson correction method and are in units of “number of amino acid substitutions per site”. The analysis involved 51 amino acid sequences. All positions containing gaps and missing data were disregarded; (B): Gene structure. Exons are shown as green boxes, and introns are shown as black lines, upstream/downstream are shown as purple boxes. Some genes lack the annotation of upstream/downstream zone; (C): Protein domains. Schematic representation of conserved motifs. Colored boxes indicate different conserved motifs.

