Figure 4.
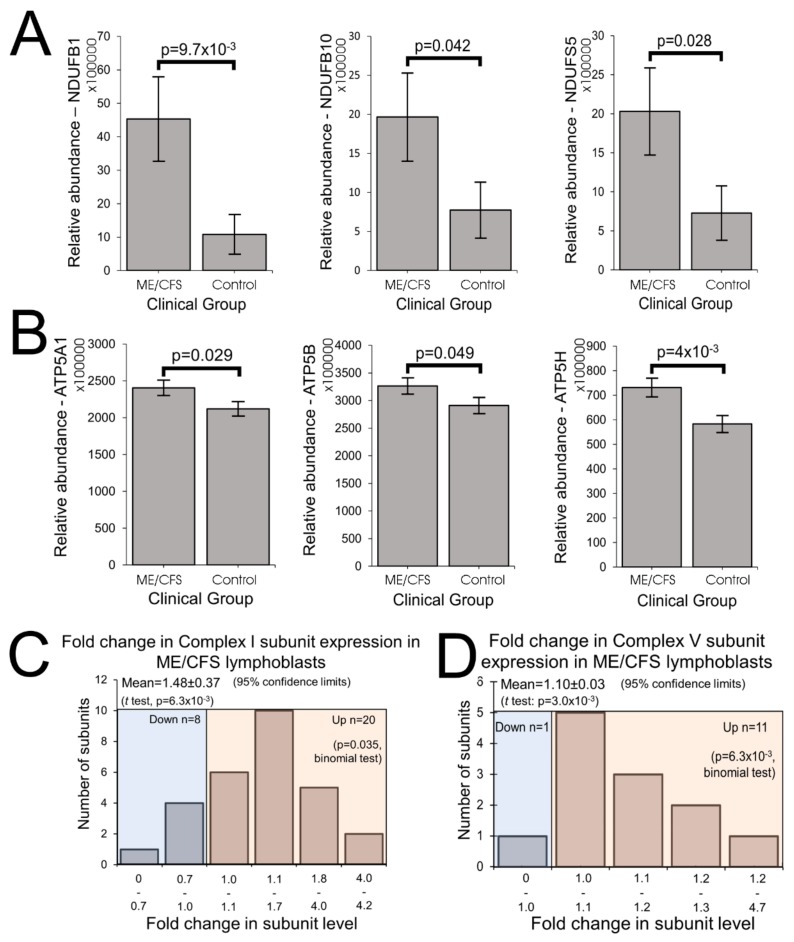
ME/CFS lymphoblasts exhibit elevated expression of Complexes I and V in their whole cell proteomes. (A) Complex I subunits NDUFB1, NDUFB10, and NDUFS5 were significantly upregulated (iBAQ) in whole cell proteomes (independent t-test). Each ME/CFS (n = 22) and control (n = 16) cell line was sampled once. (B) Complex V subunits ATP5A1, ATP5B, and ATP5H were significantly upregulated (iBAQ) in whole cell mass spectrometry proteomics experiments (independent t-test). Each ME/CFS (n = 22) and control (n = 16) cell line was sampled once. (C) Of the 44 known Complex I subunits, 31 were present amongst the 3700 proteins detected in the whole cell proteomes, 28 of these in both control and ME/CFS lymphoblast samples. Their relative abundances were compared and the majority were elevated in ME/CFS cells (fold change > 1) The background colors separate the two tested proportions in this data: blue corresponding to the samples with reduced abundance and pink for samples with elevated abundance. (D) 12 Complex V subunits were detected within the whole cell proteomes of ME/CFS and control lymphoblasts. Their relative abundances were compared to the controls and the majority were elevated in ME/CFS cells (fold change > 1). The background colors indicate the samples with reduced abundance (blue) and samples with elevated abundance (pink).

