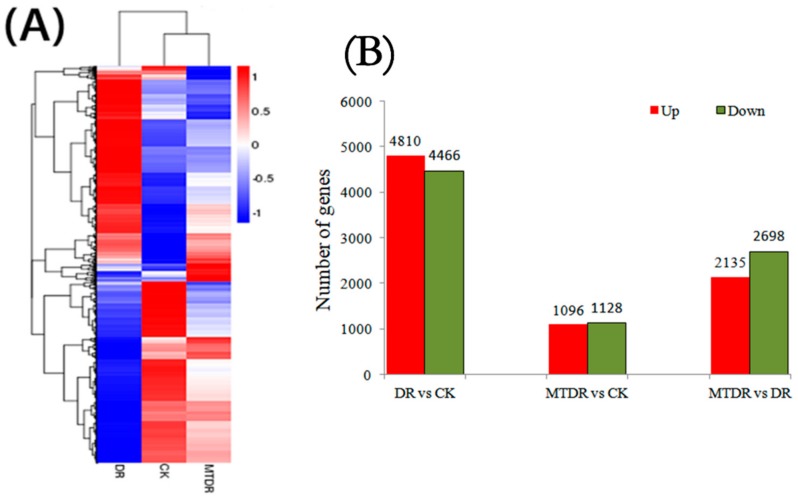
Figure 2.
The differentially expressed genes (DEGs) analysis by the hierarchical clustering heat map (A) and number of regulated genes in the different comparisons (B). (A): the color scale in the heat map ranged from blue to red, representing log10 (FPKM+1) of −1 to 1. (B): red and green columns represent genes with significantly different expression.

