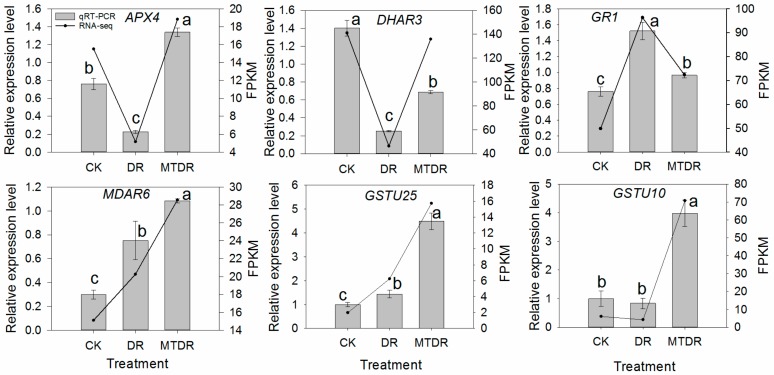
Figure 5.
Expression pattern of genes involved in AsA metabolism by RNA-Seq and qRT-PCR exposed to drought at 9 days. Different treatments (x-axis) and gene expression (y-axis) by FPKM (right) and relative expression levels (left). Gray columns in all plots indicate the relative expression level obtained by qRT-PCR; the black lines indicate the FPKM value obtained by RNA-seq. Bars represent the standard error (n = 3). Different letters indicate significant differences according to LSD tests (p < 0.05) for qRT-PCR.

