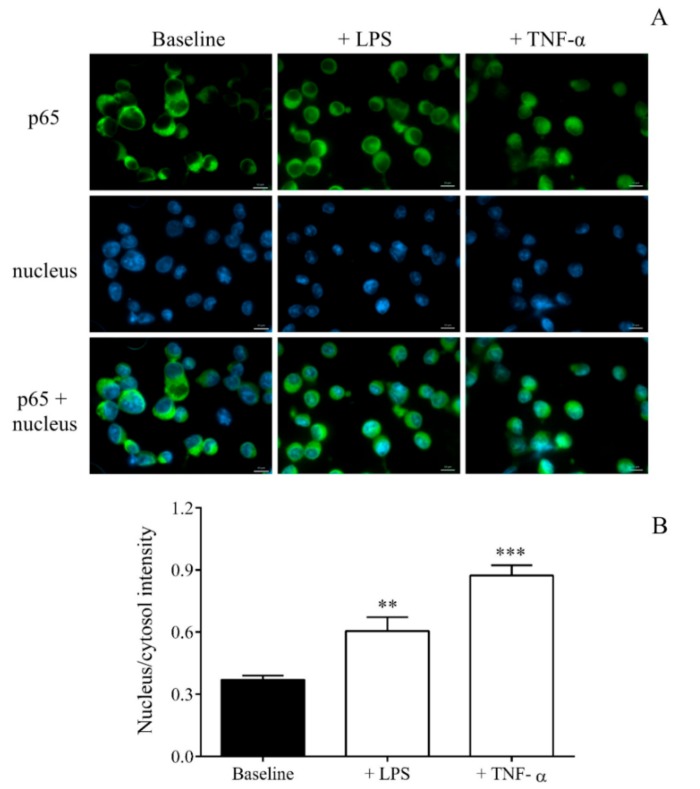
Figure 4.
Immunohistochemical staining and analysis of the nuclear factor kappa B (NF-κB) pathway activation in LPS or TNF-α treated MEG-01 cells. Megakaryocytes were stimulated with PBS (baseline), 100 ng/mL LPS or TNF-α for 4 h. Nuclear localization of the NF-κB p65 subunit was monitored by immunostaining. Green: p65 staining; blue: cell nuclei. Scale bar: 20 μm (A). The ratio of the fluorescence intensity of the NF-κB immunostaining in cell nuclei and cytosol was analyzed (B). Mean ± SEM, n = 6–10/group. ** p < 0.01 and *** p < 0.001 based on statistical analyses.

