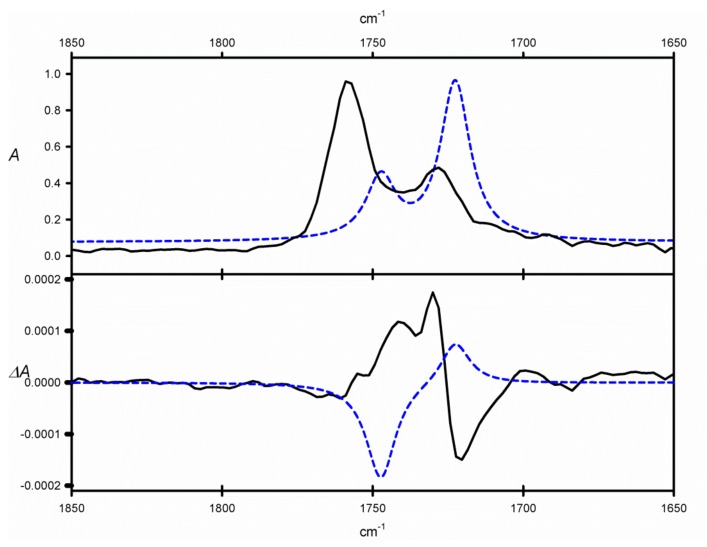
Figure 3.
IR (upper panel) and vibrational circular dichroism (VCD) (lower panel) spectra of 9, measured in CCl4 (solid black lines) and calculated (blue dashed lines) for geometries optimized at the IEFPCM (CCl4)/B3LYP/6-311G(d,p) level. The calculated VCD spectra were Boltzmann-averaged based on ΔΔG values and were not scaled. Only the region of C=O absorption (1850–1650 cm−1) is shown. The experimental, measured in the region between 850 and 2000 cm−1 and calculated IR and VCD spectra are available in Supplementary Information.

