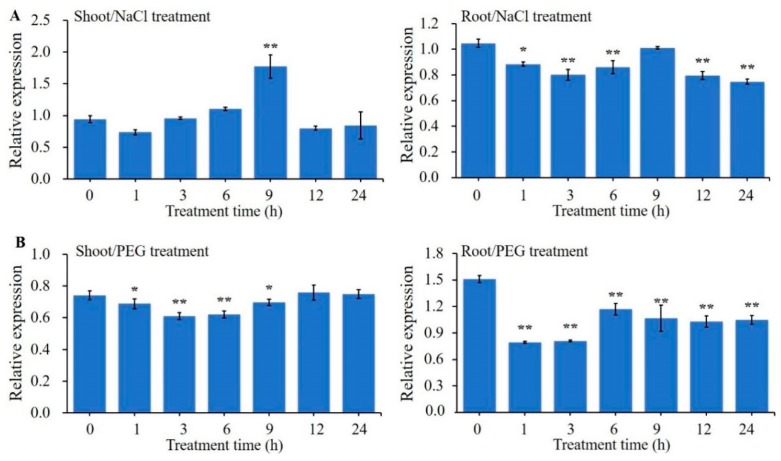
Figure 1.
Expression patterns of ZmBES1/BZR1-5 from qRT-PCR. The three-leaf stage of B73 seedlings were exposed to a water solution supplemented with 250mM NaCl (A) and 16% PEG-6000 (B). All values are means (±SE) of three biological replicates. The ZmGAPDH gene was used as internal reference. The relative expression level was calculated and normalized using the 2−ΔΔCT method of the CFX Manger™ software version 2.0 (Bio-Rad, Berkeley, CA, USA). * p < 0.05 and ** p < 0.01 by Student’s t test, respectively.

