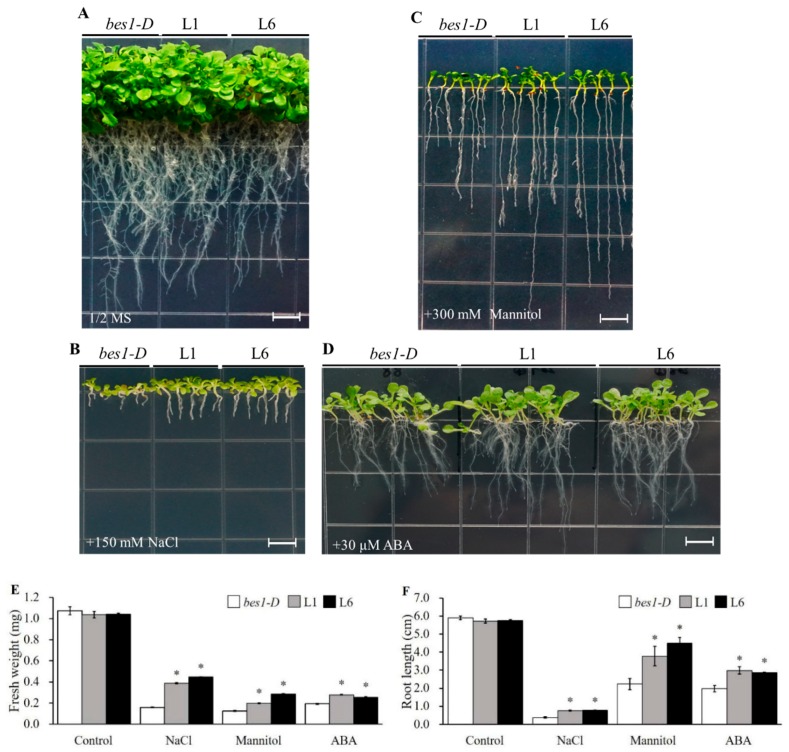
Figure 3.
Phenotypes of bes1-D, L1 and L6 lines under optimal conditions (A), 150mM NaCl (B), 300 mM mannitol (C) and 30 μM abscisic acid (ABA) (D). Quantification of fresh weight (E) and root length (F) of every line grown on 1/2× MS medium plates for three weeks. All values are means (±SE) of three biological replicates. bes1-D, L1 and L6 represent either an untransformed mutant or two homozygous T3 lines. * represents p < 0.05 by Student’s t test. Scale bars = 0.5 cm.

