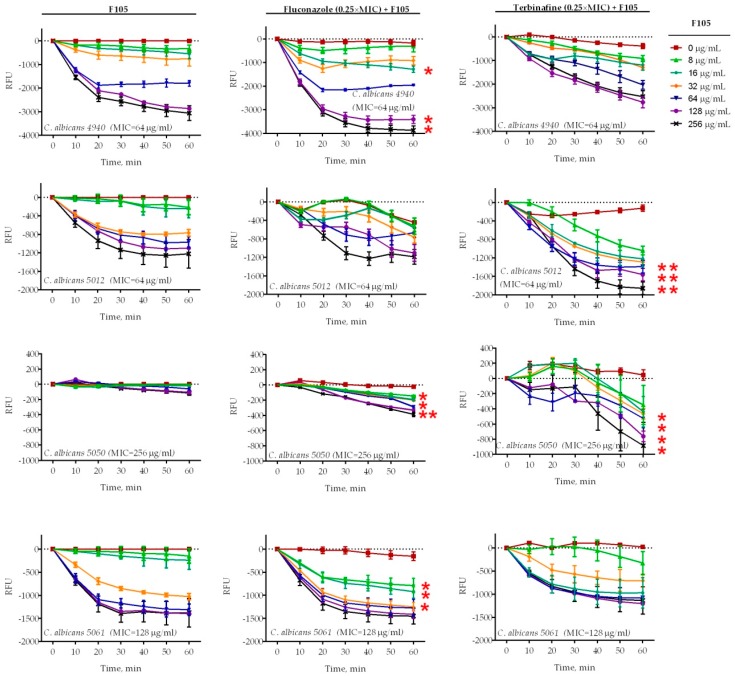
Figure 4.
Relative membrane potentials of C. albicans isolates after treatment with various concentrations of F105 and 0.25× MIC of fluconazole or terbinafine (see Table 1 for MIC values). C. albicans cells in the late exponential growth phase were harvested, washed with PBS, and resuspended in PBS supplemented with 10 µM DioC2(3). After 30 min preincubation, compounds were added as indicated and the fluorescence was measured for 60 min with 10 min intervals. Lines represent the median values with IQRs from five independent measurements. In cases marked with *, the measured relative fluorescence units (RFUs) after 60 min of exposure were significantly lower in the presence of F105 compared to similar treatments in the absence of F105 according to the Kruskal–Wallis statistical test at p < 0.05. Corresponding MICs for F105 are given in parentheses after the strain names.

