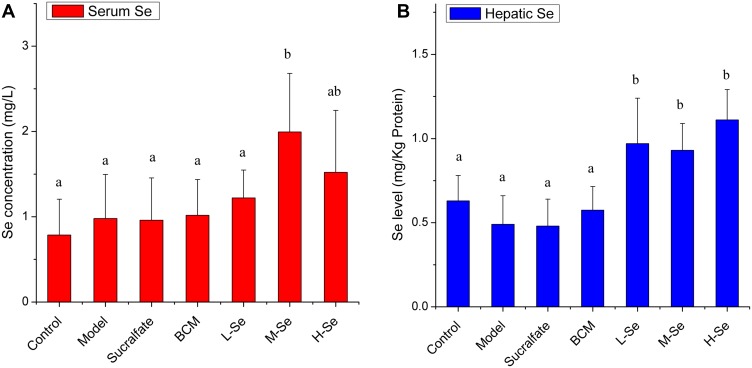
Figure 3.
The serum Se concentration (A) and hepatic Se level (B) in Wistar rats. The daily administration of each group was performed as shown in Table 1. After the last administration, rats were deprived of food, allowed free access to water. Twenty-four hours later, rats were given ethanol or saline, and they were sacrificed in 1 hr to obtain serum, liver and other organs. The samples were digested in hydrogen nitrate/hydrogen peroxide (HNO3/H2O2) solution, and then, the Se content in the digestion was determined by using ICP-MS assay. a–bMeans within a panel with different letters differ significantly (P < 0.05).

