Figure 1.
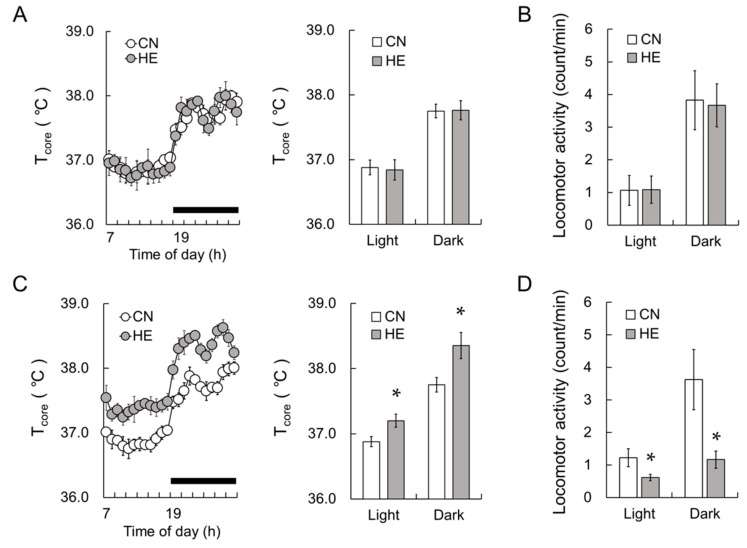
The core body temperature (Tcore) and locomotor activity of control (CN) and heat-exposed (HE) rats. (A) The left graph shows Tcore of CN (open circle) and HE (gray circle) rats measured 1 day before the heat exposure period. The right graph presents mean Tcore in the light (Light) and dark phases (Dark) in the CN (open column) and HE groups (gray column). (B) Locomotor activity of CN (open column) and HE rats (gray column). Tcore and locomotor activity for (A) and (B) were measured 1 day before heat exposure. (C) The left graph indicates Tcore in the CN and HE groups during heat exposure. The right graph presents mean Tcore in the light and dark phases in the CN (open column) and HE groups (gray column) during heat exposure. Dark bars above the abscissa indicate the dark phase data. (D) Locomotor activity in the CN (open column) and HE groups (gray column). Tcore and locomotor activity for (C) and (D) were measured on 2nd to 5th day of heat exposure and summarized for 24 hours. Values are presented as the mean ± SEM (n = 8 in each group). * p < 0.05, significant difference between the CN and HE groups.

