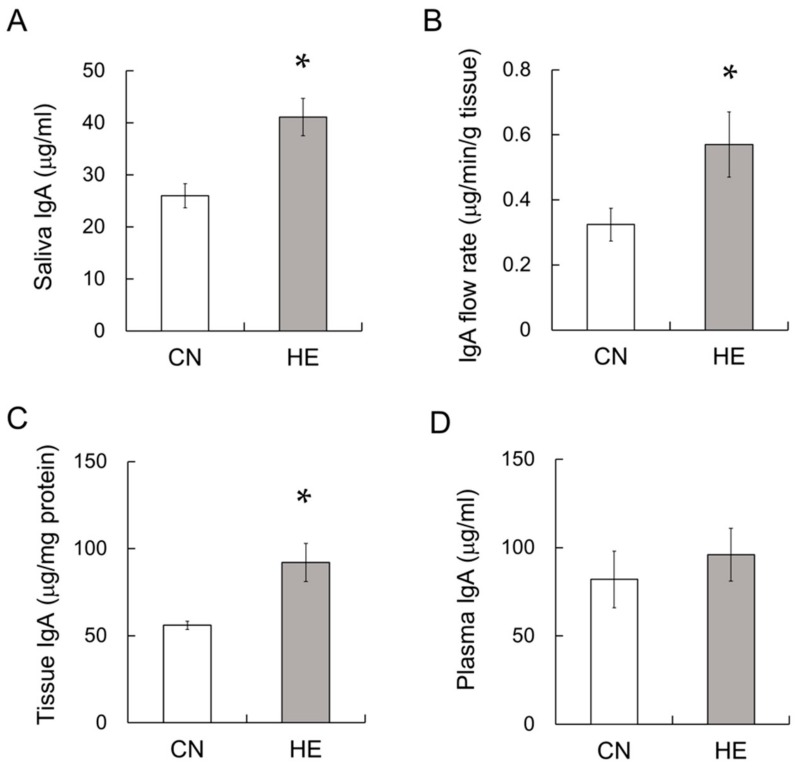
Figure 2.
Salivary immunoglobulin A (IgA), IgA flow rate, IgA in the submandibular glands (SMGs) and plasma IgA levels in control (CN) and heat-exposed (HE) rats. (A) IgA concentration in saliva. (B) IgA flow rate. (C) IgA concentration of the SMGs and (D) plasma. Values are presented as the mean ± SEM (n = 8 in each group). * p < 0.05, significant difference between the CN and HE groups.

