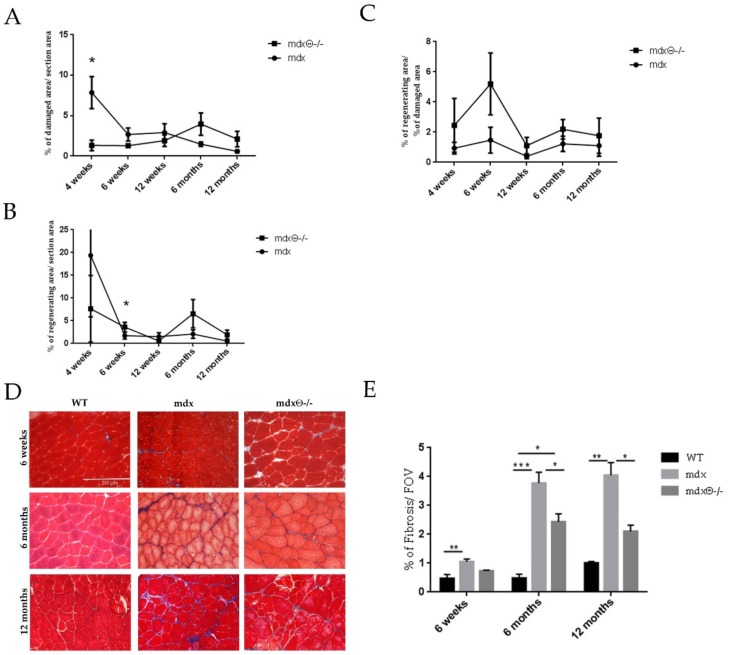
Figure 1.
(A) Muscle degeneration level evaluated in mdx or mdx/θ−/− mice at the indicated ages, quantified as the percentage of damaged area over the total area in H&E stained TA cryosections. (B) Muscle regeneration as in A, quantified as the percentage of eMHC positive area over total area of TA cryosections. (C) Ratio of regenerating area over damaged area determined in mdx and mdx/θ−/− mice at each age evaluated. The results are mean ± SEM (n = 4–5/age/genotype); * p < 0.05 two-tailed Student’s t-test). (D) Representative images of Masson’s trichrome staining of cryosections derived from WT/bl10, mdx and mdxθ−/− TA muscle at 6 weeks, 6 and 12 months (bar = 200 µm). (E) Fibrosis was quantified as the percentage of Masson’s trichrome positive area per field of view in TA section. Statistical significance was determined by a one-way ANOVA using a Tukey’s post-test (* p < 0.05, ** p < 0.01, *** p < 0.001 means ± SD).

