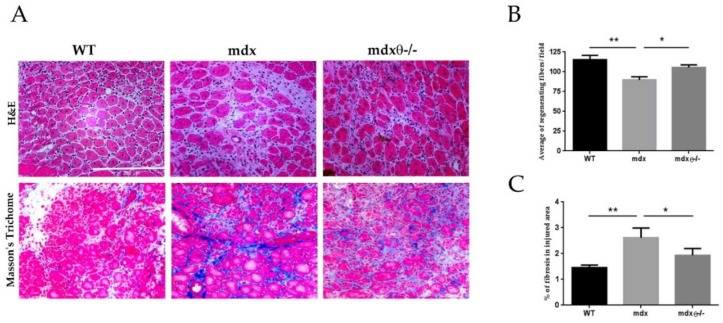
Figure 2.
(A) Representative image of TA stained with H&E (upper panels) and Masson’s trichrome staining (lower panels) of 6- month-old WT/bl10 (n = 3), mdx and mdxθ−/− mice (n = 5/genotype), as indicated, at day 7 after CTX injury (bar = 200µm). (B) Average of number of regenerating fibers and (C) Quantification of collagen deposition per field of view. Statistical significance was determined by a one-way ANOVA using a Tukey’s post-test (* p < 0.05, ** p < 0.01, means ± SD).

