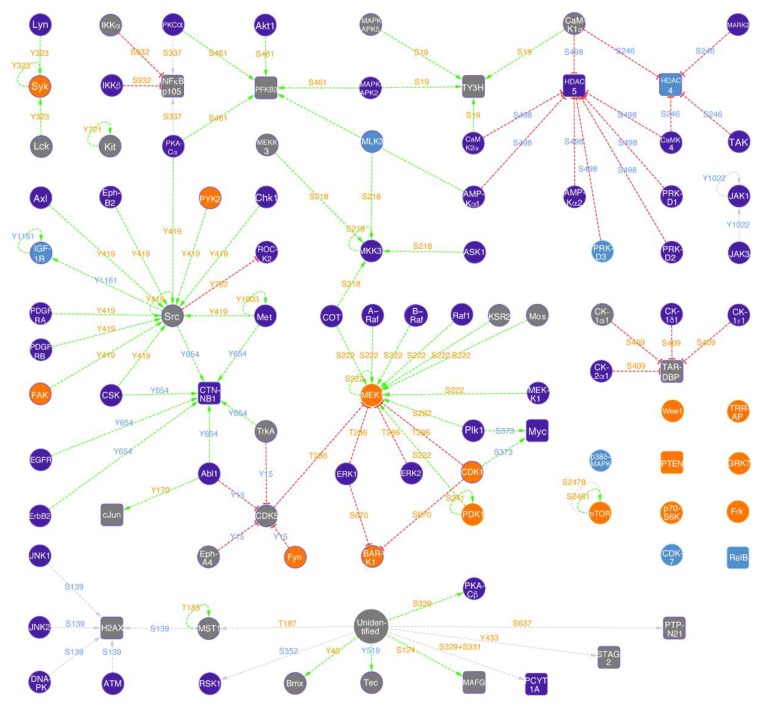
Figure 6.
KiNetscape representation of norvaline treatment associated hippocampal signaling (qualitative map style). Protein kinases are represented with circular icons and other proteins with rounded box icons (nodes). Activating phosphorylation events are shown with green dotted lines and arrows, inhibitory phosphorylation with red dotted lines and phosphorylation with undefined effects with grey dotted lines (edges). Proteins that showed increased expression changes greater than 45% are colored orange, and appear blue if there was a decreased expression greater than 45%. Protein expression changes less than 45% are not identified and these protein icons are colored purple. If the phosphorylation of a site on a protein was induced by more than 45%, then the text for this phosphosite is colored orange. If its phosphorylation was reduced more than 45% in response to norvaline, the text is colored blue. Changes in phosphorylation less than 45% are not indicated and the text for these phosphosites appears grey. The appearance of a positive or negative sign in front of the phosphorylation site text indicates if the site is known to be stimulatory or inhibitory, respectively.

