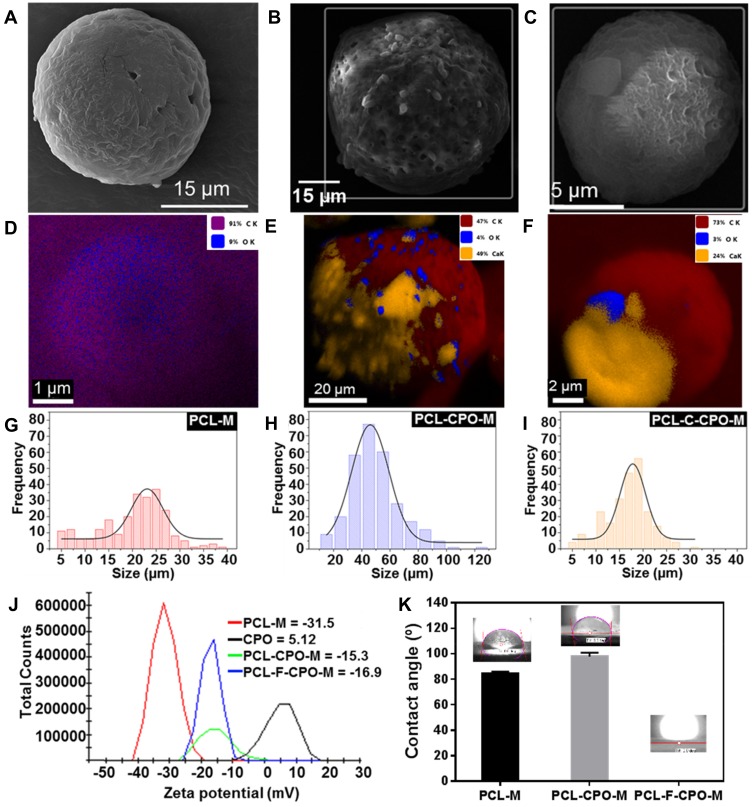
Figure 4.
Scanning electron microscopy (SEM) image of the various microparticles (A) PCL-M, (B) PCL-CPO-M, and (C) PCL-F-CPO-M. The SEM-Energy dispersive X-ray spectroscopy (EDS) of the (D) PCL-M, (E) PCL-CPO-M, (F) PCL-F-CPO-M. The size distribution presented in the histogram of the (G) PCL-M, (H) PCL-CPO-M, and the (I) PCL-F-CPO-M. (J) The zeta potential distribution of the fabricated microparticles and the CPO. (K) Contact angle (CA) of the films deposited by electrospray on glass substrate.

