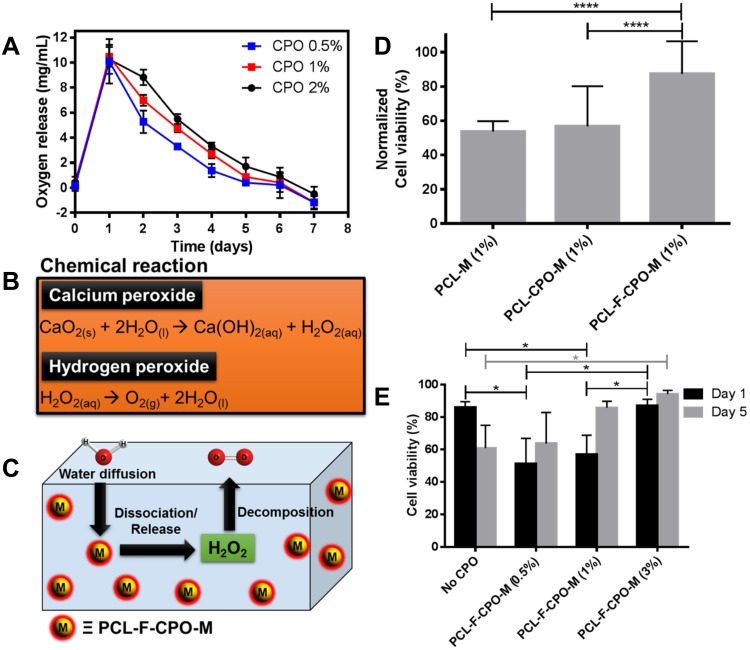
Figure 5.
(A) The oxygen release assay with three different concentrations of the CPO in the PCL-F-CPO-M for up to 7 days. (B) The chemical reaction for the release/dissociation of the CPO into free oxygen in the presence of water (H2O). (C) A schematic image describing the process to release oxygen from our microparticle system (PCL-F-CPO-M). (D) The cell viability results from rat chondrocytes encapsulated in 10% GelMA hydrogel with the various microparticles (PCL-M (1%), PCL-CPO-M (1%) and PCL-F-CPO-M (1%)). The data are normalized between 1 and 5 days in 3D cell culture (n = 3). (E) The cell viability results from rat chondrocytes encapsulated in 10% GelMA hydrogel with varying concentrations of PCL-F-CPO-M (2%) after 1 and 5 days in 3D cell culture (n = 3). Data are expressed as mean ± standard deviation, N = 3. ANOVA (p< 0.05) following by Tukey’s multiple comparison tests. *p< 0.05, ****p< 0.001.

