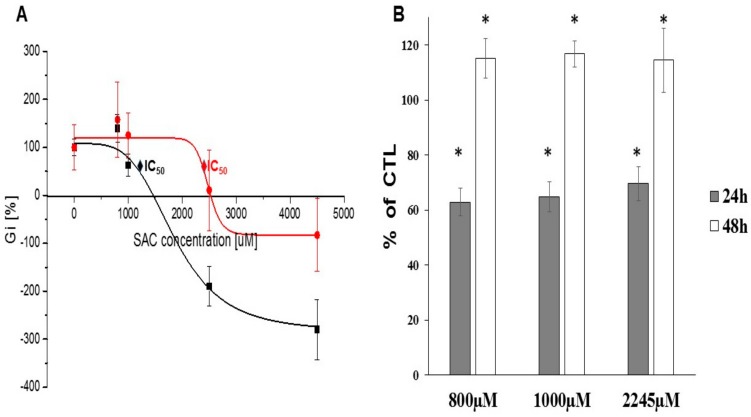
Figure 1.
The cell viability after the 24 h and 48 h incubations with 800 µM, 1000 µM and 2245 µM SAC in the MCF-7 cell culture (A) generated by OriginPro 9.1 program, (B) the MTT assay; Gi: growth inhibition, IC50: half maximal inhibitory concentration. The sigmoidal model of effect dependence on SAC dose was adjusted to the obtained data according to the method described in Lasota et al. [19]. All the data of the mean value represent the average of four to five determinations in three experimental groups. Statistical analysis was performed using the Mann–Whitney test (* p < 0.05), * p < 0.05 vs. the control.

