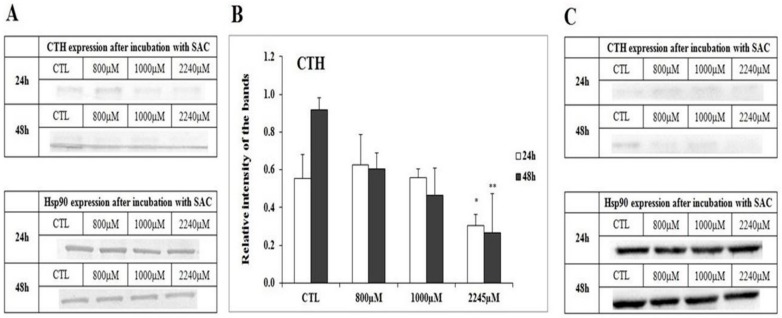
Figure 5.
The expression of γ-Cystathionase (CTH) in the breast cancer cell line (MCF-7) after the 24 h and 48 h incubations with SAC. The tested concentrations of SAC in culture medium as listed: 800 µM, 1000 µM and 2245 µM; the control refers to non-treated cells. (A) Western blot with immunodetection. Each experiment was done tree times in triplets, and a representative experiment is shown. Hsp90 is used as a control of equal loading. (B) Densitometric visualization of the expression of CTH. The error bars represent the standard deviation. (C) Western blot with chemiluminescence detection. Statistical analysis was performed using the Mann–Whitney test (* p < 0.1 ** p < 0.05, 800 µM, 1000 µM, 2245 µM SAC vs. control).

