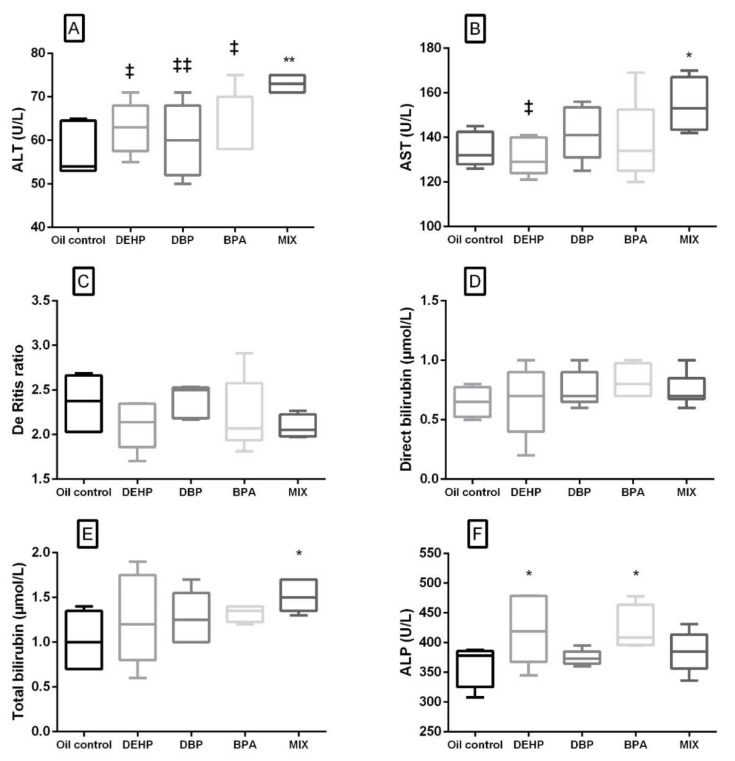
Figure 2.
Liver-related serum biochemical parameters after 28 days of oral exposure to single investigated substances and their mixture (MIX). Each box plot represents interquartile range (25–75th percentile), the line within the box represents median value, and ends of the whiskers represent the minimum and maximum values within the group. (A) ALT activity (U/L), (B) AST activity (U/L), (C) the De Ritis ratio (AST/ALT), (D) direct bilirubin concentration (μmol/L), (E) total bilirubin concentration (μmol/L), (F) ALP activity (U/L) ((DEHP, DBP and BPA) * p < 0.05, ** p < 0.01 (compared to the control), ‡ p < 0.05, ‡‡ p < 0.01 (compared to the MIX group).

