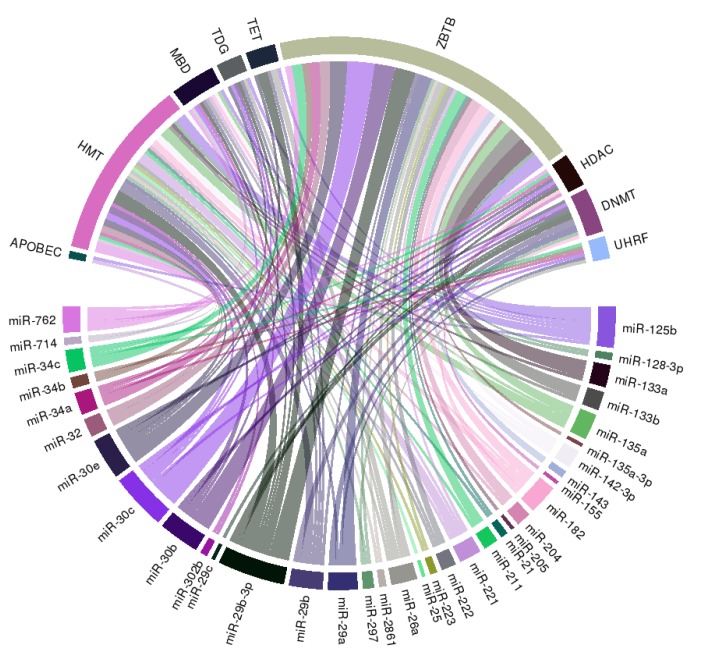
Figure 3.
A circular ribbon chart depicting interactions between literature-identified miRNAs in Table 1, and key molecules involved in DNA methylation and histone modification. The thickness of the ribbon is reflective of the scores assigned by the literature addressing the relationship based on miRNAtap (R package version 1.16.0; R foundation for Statistical Computing, Vienna, Austria) and topGO (R package version 2.34.0; R foundation for Statistical Computing, Vienna, Austria).

