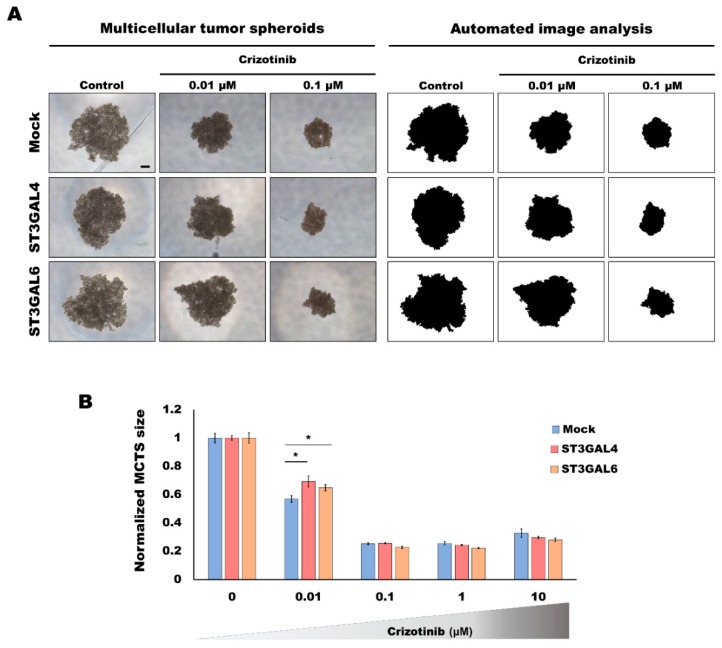
Figure 2.
Analysis of the response to tyrosine kinase inhibitor (TKI) treatment of the α2,3-overexpressing cancer cell models grown in 3D. Response to crizotinib treatment evaluated by automated image analysis of gastric multicellular tumor spheroids (MCTS) generated using ultra-low attachment (ULA) 96-well round-bottomed plates for 5 days and treated with different concentrations of crizotinib for 48 h. (A) Representative examples of the automated image analysis performed with the open-source Fiji software to determine the size of the gastric MCTS from images acquired with a Leica DMi1 microscope. Scale bar represents 200 μm. (B) Graph represents the size variation in each spheroid after 48 h of treatment. Values are means ± SD of at least n = 3 spheroids. For each condition, 2 independent experiments were performed. Statistical significance was determined by student’s t-test (p-value < 0.05 was considered significant, indicated as *).

