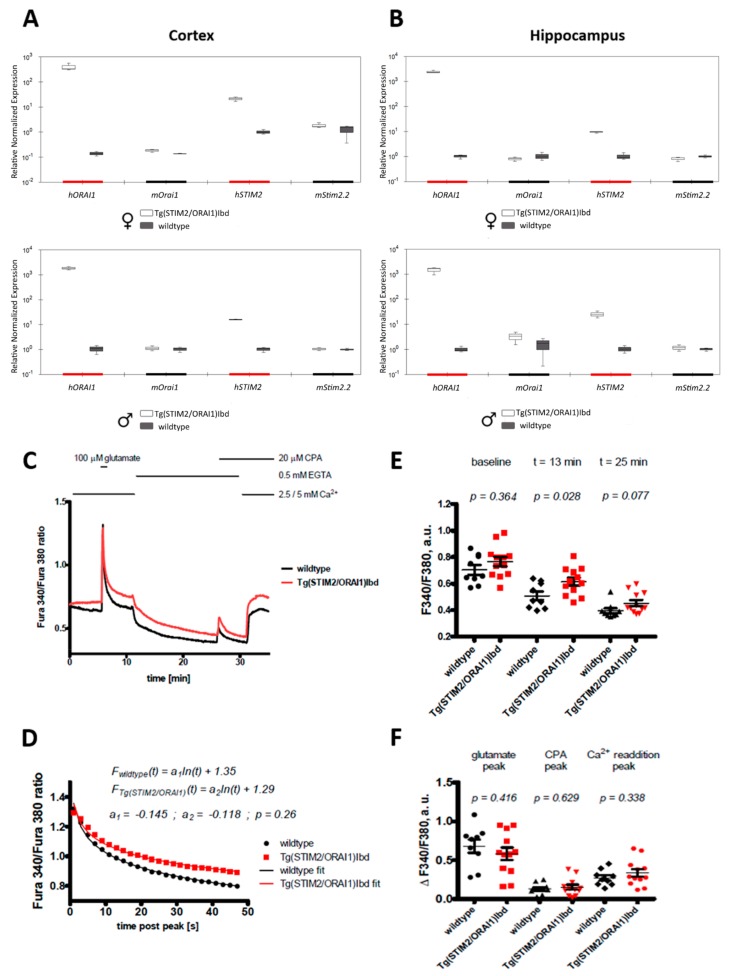
Figure 1.
Altered Ca2+ response in a modified Ca2+ addback assay in CA1 hippocampal region from Tg(STIM2/ORAI1)Ibd line. (A,B) Expression levels of isoforms of STIM2 and ORAI1 in the cortex and hippocampus of male and female mice. (C) Averaged time-course of fluorescence signal. The measurements were performed using Fura-2 AM dye that was loaded into the CA1 neurons of the acute hippocampal brain slices. About 20 pyramidal neurons per slice (n) were analyzed; 1–2 slices from one animal were analyzed. The total number of analyzed slices was equal to 9 and 12 for wildtype and transgenic variants, respectively. (D) Time-course of signal decay following stimulation by glutamate that was fit by a logarithmic function. Student’s t-test was used to check statistical significance of the observed differences; p-values are provided above the respective charts. (E) Quantification of baseline F340/F380 values and following the application of Ca2+ chelator, EGTA; at 13th and 25th min of the measurement, a.u. (F) Quantification of signal amplitudes that were observed following treatment by glutamate and cyclopiazonic acid (CPA), and Ca2+ addition; arbitrary units (a.u.).

