Figure 6.
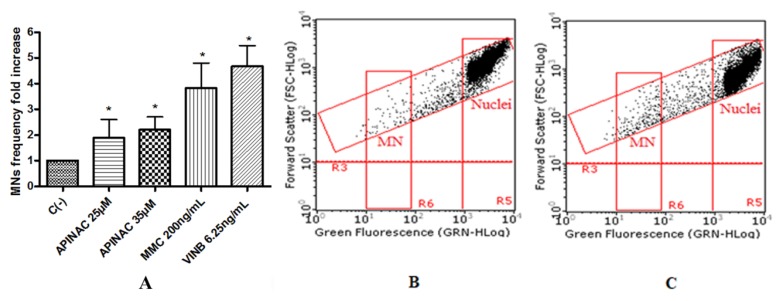
MN’s frequency fold increase on TK6 cells after 26 h treatment with APINAC at the indicated concentrations with respect to the untreated negative control [C (-)] and to positive controls [MMC and VINB] (A), plot of nuclei and micronuclei in untreated control (B) and in 25 µM treated (C). Data were analyzed using repeated ANOVA followed by Bonferroni post-test. * p < 0.05 versus C (-).

