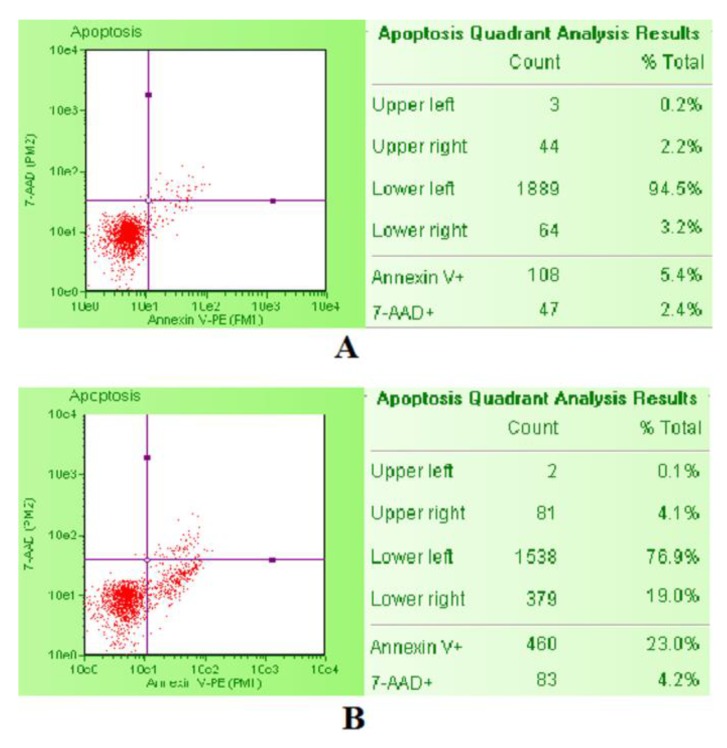
Figure 9.
Example of the three populations identifiable with the Guava Nexin Reagent and analyzed with the Guava Nexin Software in untreated negative control (A) and staurosporine-treated positive control (B). On the lower left are the live cells 7-AAD and Annexin-V-PE negative, on the lower right the apoptotic cells 7-AAD negative and Annexin-V-PE positive, on the upper right the necrotic cells 7-AAD and Annexin-V-PE positive.

