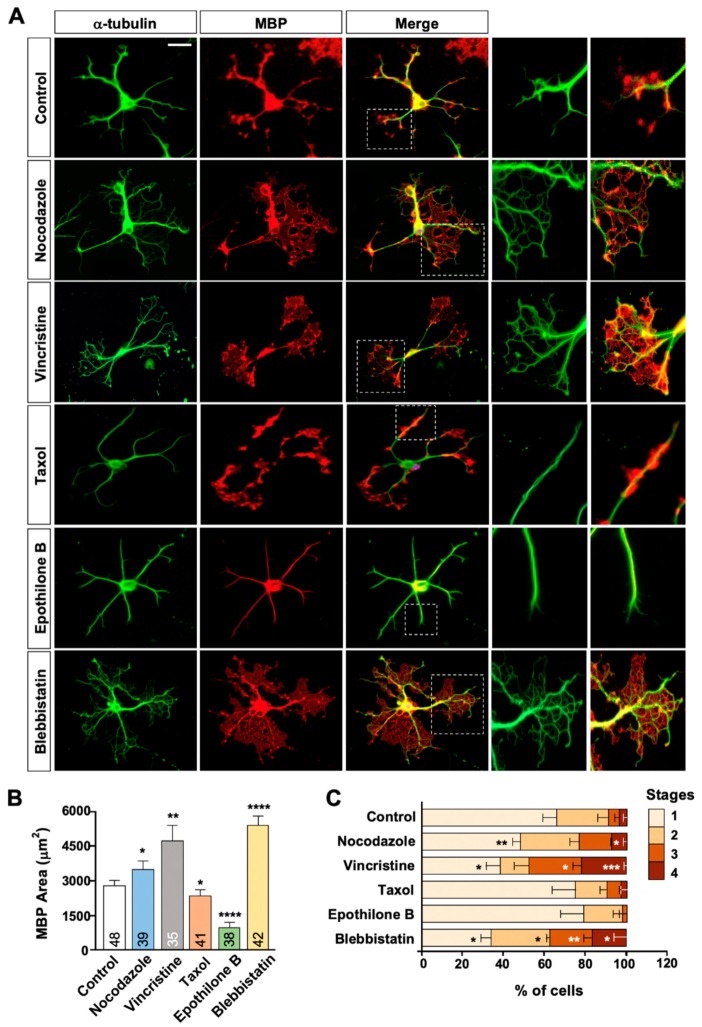
Figure 4.
MTAs affect MT arborization, MBP expression, and oligodendrocyte differentiation. (A–C) Oligodendrocytes were treated with 2 nM of each MTA at DIV 3. Cells were fixed at DIV 5 and immunostained with anti-α-tubulin and anti-MBP antibodies. (A) Representative images of control and MTA-treated oligodendrocytes. White boxes are enlarged at right. Scale bar, 25 µm. (B) Quantification of area occupied by MBP immunostaining in each oligodendrocyte. Graph shows mean ± SEM. Total number of cells pooled from at least three independent experiments are depicted in each bar. (C) Quantification of differentiation stages. Morphological criteria of differentiation stage are identical to Figure 1A. Graph shows mean ± SEM. n = 3. * p < 0.05, ** p < 0.01, *** p < 0.001, and **** p < 0.0001. Mann–Whitney test in (B,C).

