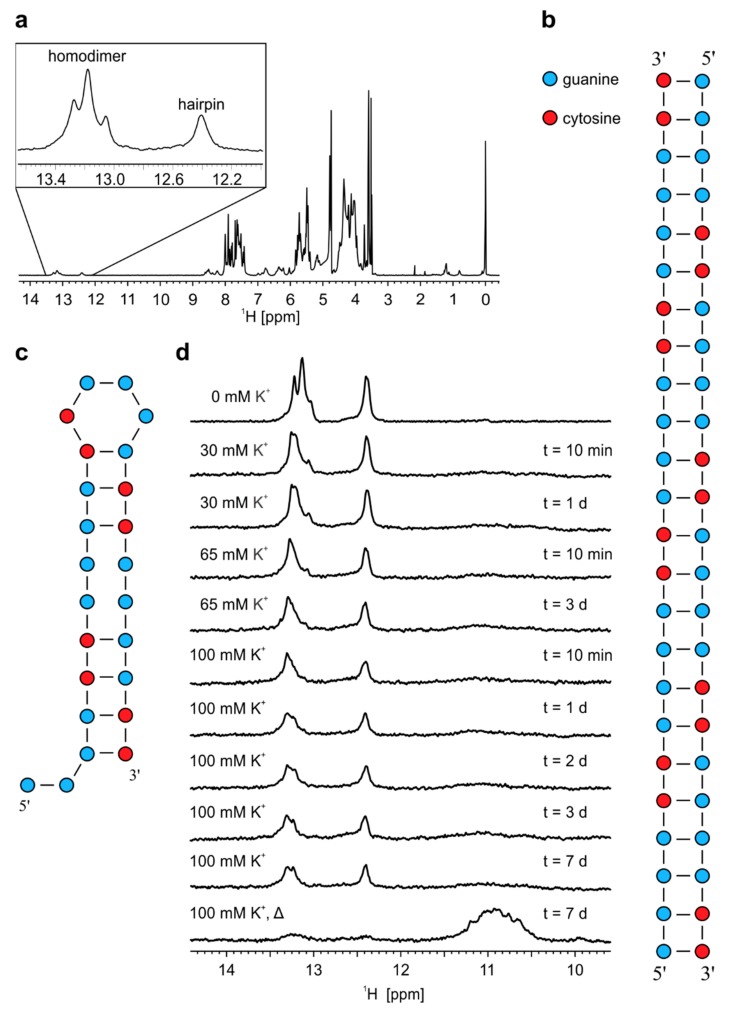
Figure 3.
1H-NMR spectra and proposed models of structures adopted by r(G4C2)4. (a) 1H-NMR spectrum of r(G4C2)4 in 10% 2H2O at pH 6.0, 25 °C and 0.9 mM oligonucleotide concentration per strand. Schematic presentation of (b) homodimer and (c) hairpin adopted by r(G4C2)4. (d) Imino regions of 1H-NMR spectra of r(G4C2)4 in 10% 2H2O at different concentrations of K+ ions. KCl solution was gradually titrated into the sample up to the stated concentration of K+ ions, displayed on the left of the NMR spectra. Δ represents NMR spectrum after annealing while t on the right represents time after each addition of K+ ions until acquisition of NMR spectrum. All spectra were acquired at 25 °C, pH 6.0 and 0.2 mM oligonucleotide concentration per strand.

