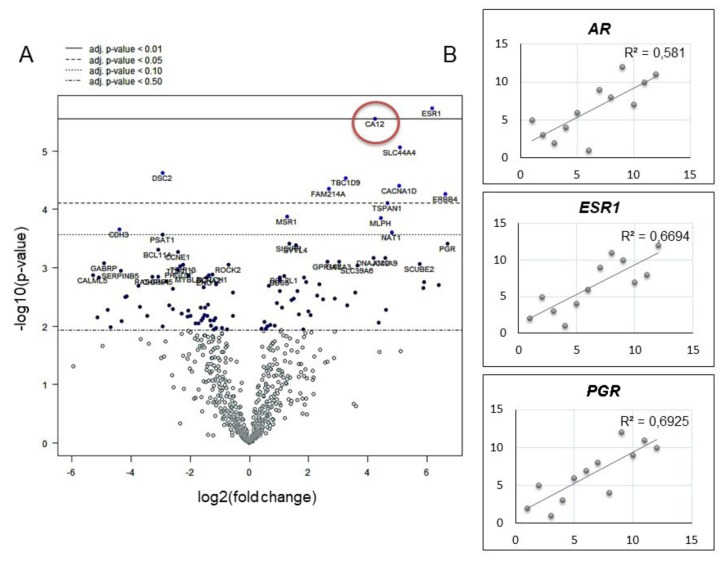
Figure 2.
mRNA analysis of CA12 expression in breast cancer tumors. (A) Differential expression between luminal A and triple negative patients analyzed on NanoString data: fold change of 4.23 (95%CI: 3.51–4.95, p = 0.0066). (B) Correlation of transcripts per million (TPM) counts analyzed by RNA-seq between CA12 and hormone receptor genes: CA12 showed a positive correlation with androgen receptor (AR), estrogen receptor (ESR1), and progesterone receptor (PGR) with a Spearman correlation coefficient of 0.766, 0.818, and 0.832, respectively. All coefficients were statistically significant (p = 0.0020; p = 0.00057; p = 0.00039).

