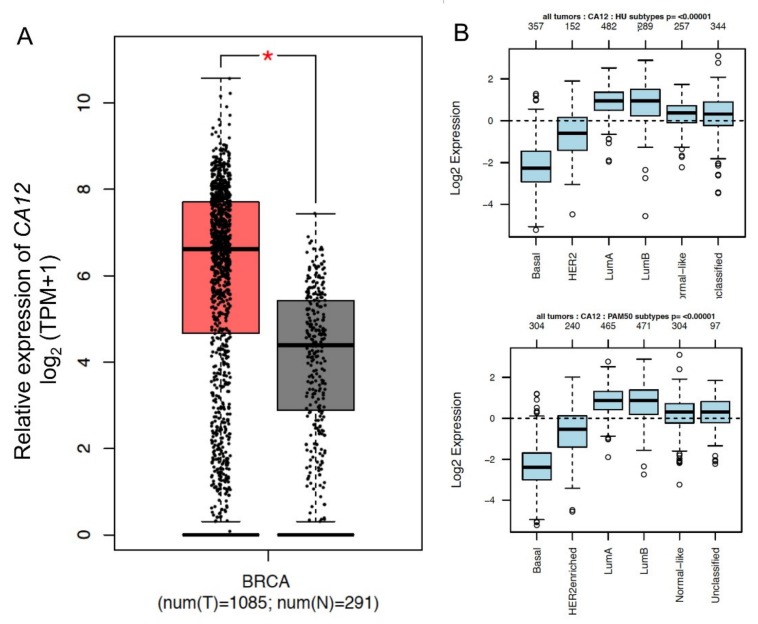
Figure 3.
Bioinformatics analysis of CA12 expression in breast cancer tumors. (A) Expression level of CA12 in cancer and normal tissues. The RNA-seq data are expressed as relative gene expression using transformed log2 (TPM+1) value (Y-axis) of tumor (red) and normal (dark grey) samples from BRCA cancer types and displayed as a whisker plot. BRCA: Breast Invasive Carcinoma. p-value * < 0.01 based on one-way ANOVA. (B) CA12 expression in six subtypes of breast cancer tumors. Patients were stratified according to HU and PAM50 subtypes applying the gene Set Analysis (GSA) of GOBO database.

