Figure 6.
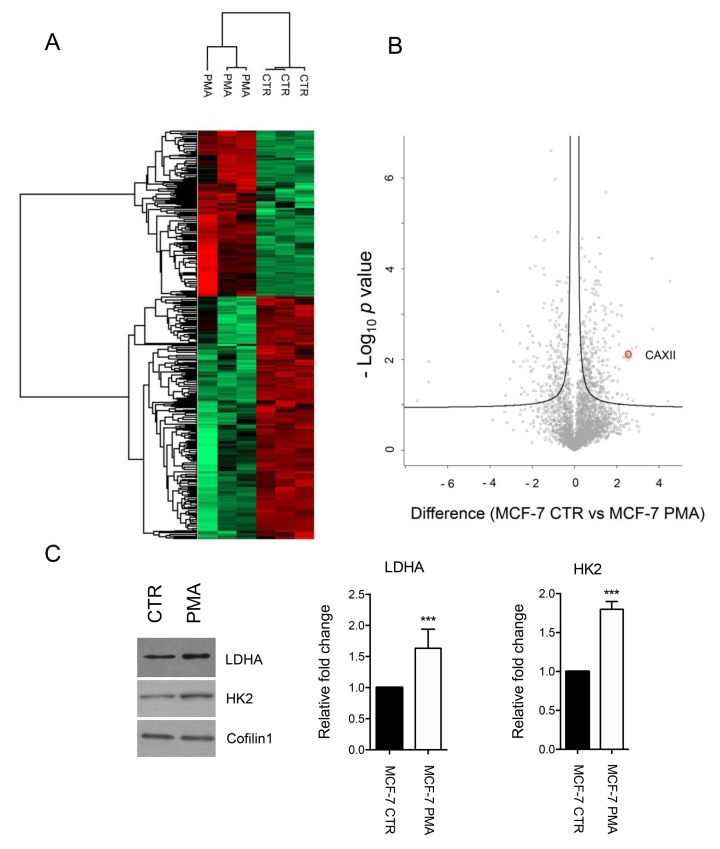
Mass spectrometry analysis of PMA-treated MCF-7 cells. (A) Heat map based on Euclidean distance that showed a significant separation between the control and PMA-treated MCF-7 cells. Color scale ranges from red to green (highest to lowest relative expression). Each column of the heat map represents an independent sample and each row represents a specific protein. (B) Differentially expressed proteins obtained by MS/MS analysis are ranked in a volcano plot according to their statistical p-value (y-axis) and their difference (log2 fold change). CAXII is highlighted. The curve is derived at FDR = 0.05 and s0 = 0.1. (C) Western blot analysis and band density quantification of LDHA and hexokinase-2 (HK2) expression in control and PMA-treated MCF-7 cells. Anti-Cofilin 1 was used as loading control. Band density was measured using ImageJ. p-value *** < 0.001 by t-test.

