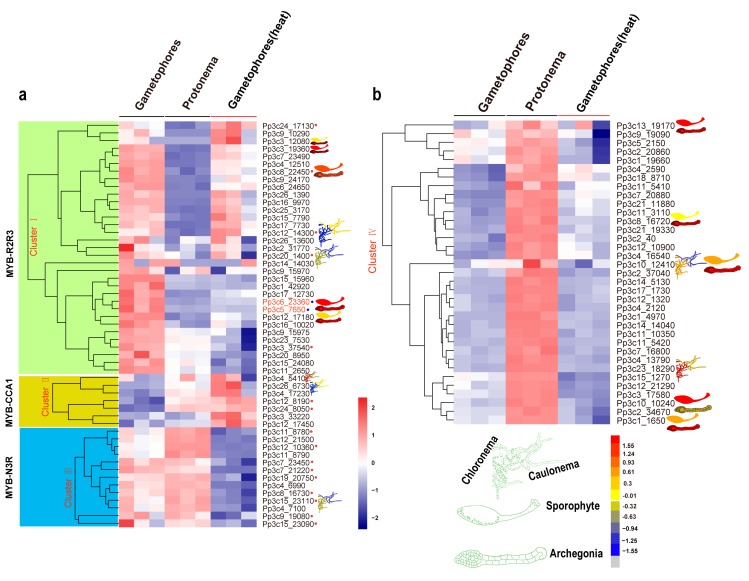
Figure 5.
Expression profiles of Physcomitrella patens MYB genes at different developmental stages and in response to heat stress. Relative expression level of MYB genes in plant tissues and organs, in particular cell types, and different developmental stages were retrieved from the BAR database (http://bar.utoronto.ca). (a,b) The heat map shows the expression profiles of MYB genes in P. patens at the protonema and gametophore stages and at the gametophore stage after heat treatment. Each box in the heatmap represents a biological replicate. The color represents RPKM normalized log2-transformed value, blue means a downregulation gene, and brick means an upregulation gene. MYBs in the red circle belongs to different subgroups while the blue circle indicates orthologs of MpFGMYB in P. patens.

