Figure 2.
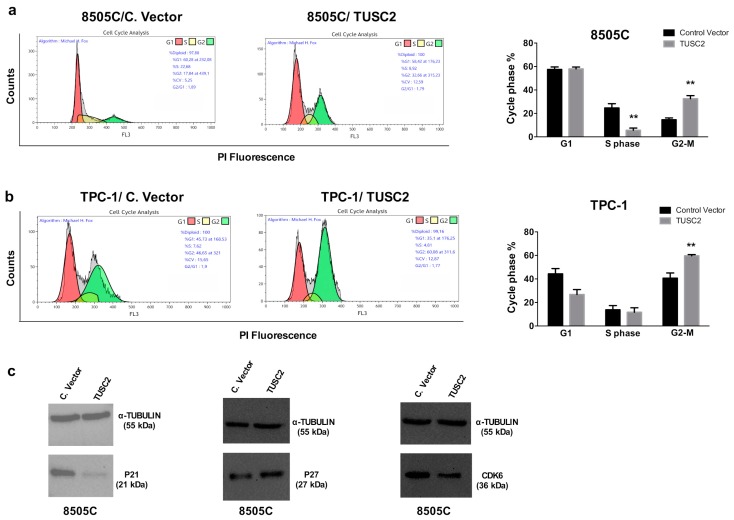
TUSC2 forced expression reduced thyroid cancer cell proliferation. Flow cytometry analysis of the cell cycle distribution in 8505C (a) and TPC-1 (b) cells stably transfected with TUSC2 or with Control Vector (C. Vector) plasmids. A representative fluorescence-activated cell sorting (FACS) plot is shown in the left panel while the average of two independent experiments is shown on the right. ** p < 0.01. Error bars indicate standard errors. (c) Western blot of p21, p27, CDK6 and TUBULIN in 8505C/C. vector and 8505C/TUSC2 cells.

