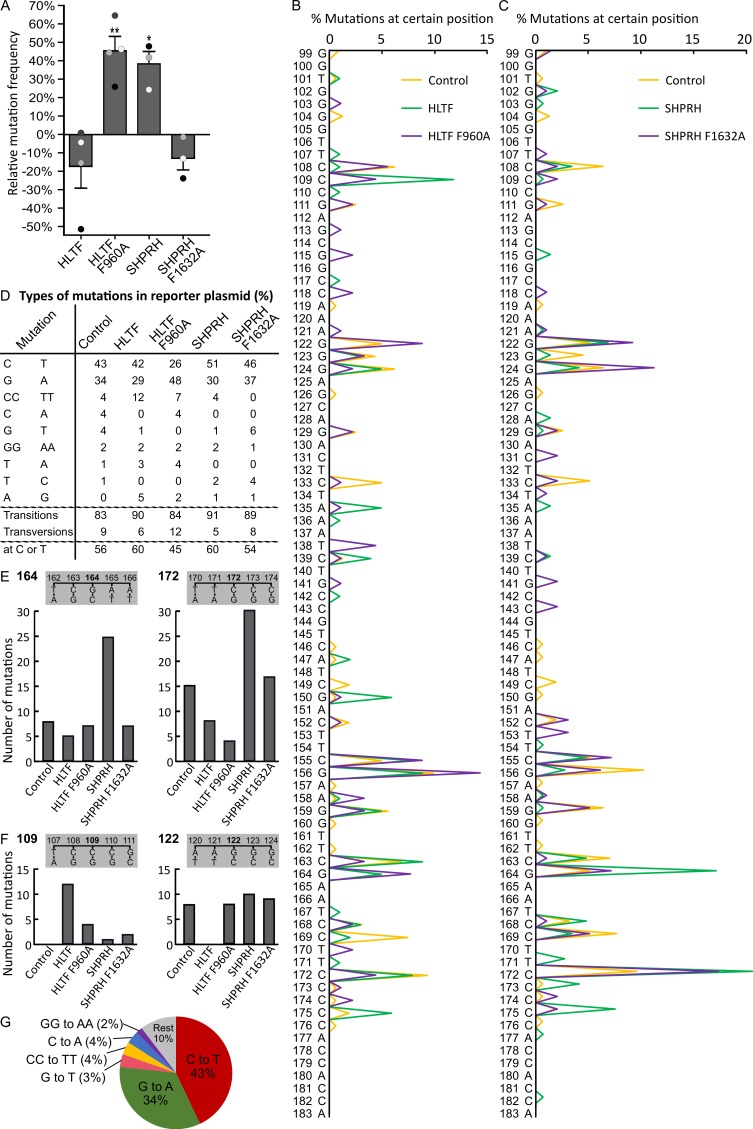
Figure 3.
Mutation of APIM in HLTF and SHPRH results in differences in mutation frequencies and mutation spectra. (A) Mutation frequencies after overexpression of HLTF, HLTF F960A, SHPRH, or SHPRH F1632A, together with SupF reporter plasmid pSP189, relative to control (reporter plasmid only) in HEK293 cells from three or four biological replica (depicted as white, grey, and black dots). DNA from each biological replica was transformed until obtaining 1000–4000 colonies per replica. The total number of colonies counted are: HLTF (n = 14700), HLTF F960A (n = 13321), SHPRH (n = 11183), SHPRH F1632A (n = 14709), and control (n = 17560). Two-sided Student’s t-test relative to control, * p < 0.05, ** p < 0.01. (B,C) Mutation spectra received from sequencing mutant colonies from (A). HLTF (n = 102), HLTF F960A (n = 91), SHPRH (n = 152), SHPRH F1632A (n = 102), and control (n = 163). (D) Quantification of different mutations using sequencing results from (B,C). Mutations with prevalence ≥ 2% are shown. Mutations at T or C bases (putative coding strand mutations) in supF (E) Mutations at position 164 and 172 in supF isolated from cells overexpressing HLTF, HLTF F960A, SHPRH, or SHPRH F1632A compared to control. (F) Mutations at position 109 and 122 in supF isolated from cells overexpressing HLTF, HLTF F960A, SHPRH, or SHPRH F1632A compared to control. (G) Distribution of mutations using sequencing results from (B,C) received from reporter plasmids isolated from control cells.

