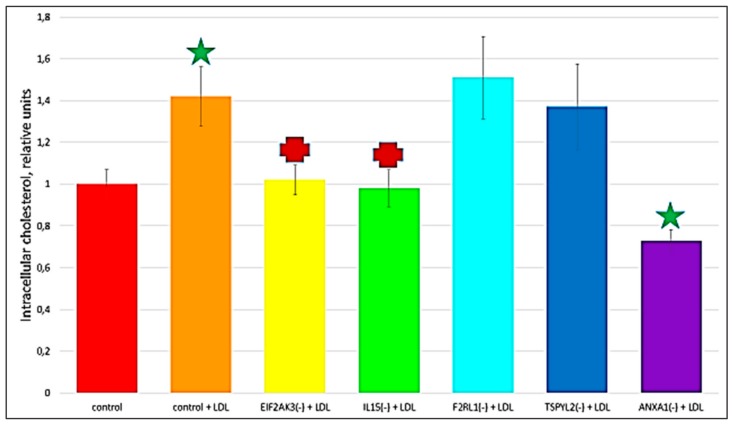
Figure 4.
The effect of gene knock-down on cholesterol accumulation in cultured macrophages. ‘Control’, macrophages with the addition of control siRNA that did not lead to gene knock-down. + LDL, atherogenic naturally occurring LDL (50 µg protein/mL) was added to cultured cells. Star, significant difference from ‘control’ (p < 0.04, t-test and Wilcoxon–Mann–Whitney test). Cross, significant difference from ‘control + LDL’ (p < 0.03, t-test and Wilcoxon–Mann–Whitney test).

