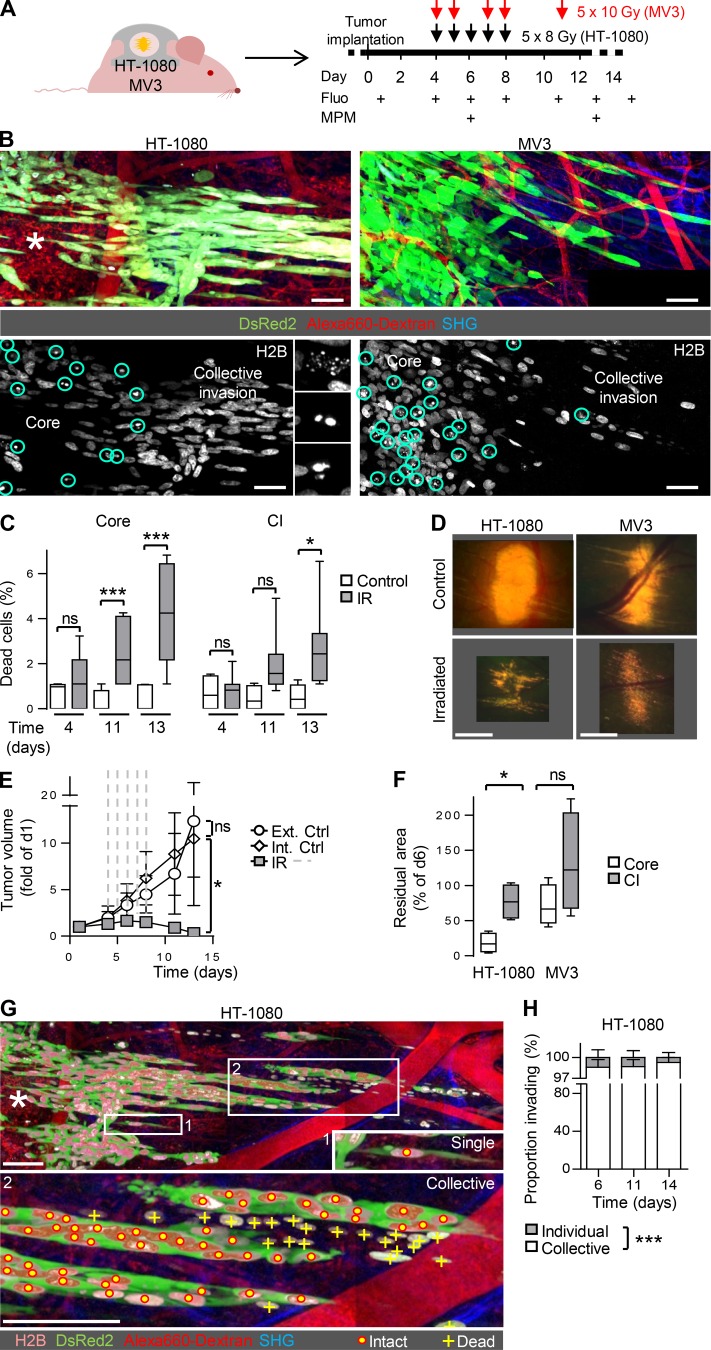
Figure 2.
Collective invasion niche mediates radioresistance. (A) Experimental procedure for sequential intravital imaging of the tumor response to fractionated IR. Fluo, epifluorescence overview microscopy. MPM, subcellular-resolved multiphoton microscopy. (B) Differential response to radiation therapy in invasion strands and tumor core. Multiphoton microscopy images show the borders between core and collective invasion zone (day 13). Black box in lower right corner (MV3) results from stitching of adjacent images without complete overlap. Asterisk, regressing tumor core. Circles and insets in lower panel, nuclear fragmentation used for quantification of dead cells. Scale bars, 50 µm. (C) Frequency of fragmented nuclei indicating dead cells in HT-1080 tumor cores and collective invasion strands. Data represent medians, 25th/75th percentiles (box), and 5th/95th percentiles (whiskers) of ∼80 nuclei per tumor region from 5–20 fields/tumor from three to four independent mice. *, P = 0.005; ***, P < 0.0001; ns, not significant. Statistics, Mann–Whitney U test (Bonferroni-corrected threshold: P = 0.008). (D) Epifluorescence overviews of whole-tumor topology in untreated and irradiated HT-1080 (5 × 8 Gy) and MV3 (5 × 10 Gy) lesions (day 13). Images are derived from Fig. S1 A (control) and Fig. S2 G (irradiated). Scale bar, 1 mm. (E) HT-1080 tumor growth before, during (dashed lines; 5 × 8 Gy), and after IR, compared with untreated tumors in independent mice (Ext Ctrl) or nonirradiated contralateral tumors in the same mouse (Int Ctrl). Means ± SD (three to nine independent tumors). *, P = 0.02 (difference between irradiated and control tumors at the endpoint [day 13]). Statistics, Mann–Whitney U test. (F) Extent of tumor regression in core and invasion zone of irradiated tumors. Data show median residual areas, 25th/75th percentiles (box), and 5th/95th percentiles (whiskers) of day 13 normalized to day 6 from four independent tumors per condition. *, P = 0.03. Statistics, paired t test. (G) Collective survival niche after IR. Multiphoton microscopy image shows the border between core and invasion zone of an irradiated HT-1080 tumor (day 14). Persisting, invading cells were quantified as individual or collective cell patterns connected by the DsRed2-positive cytosol. Dead cells were lacking cytoplasmic signal. Asterisk, regressing tumor core. Scale bars, 100 µm. (H) Classification of surviving, invading cells based on the migration pattern, including individual cells or collective strands. Data represent the means and SD from three tumors (HT-1080). ***, P < 0.0001. Statistics, paired t test.

