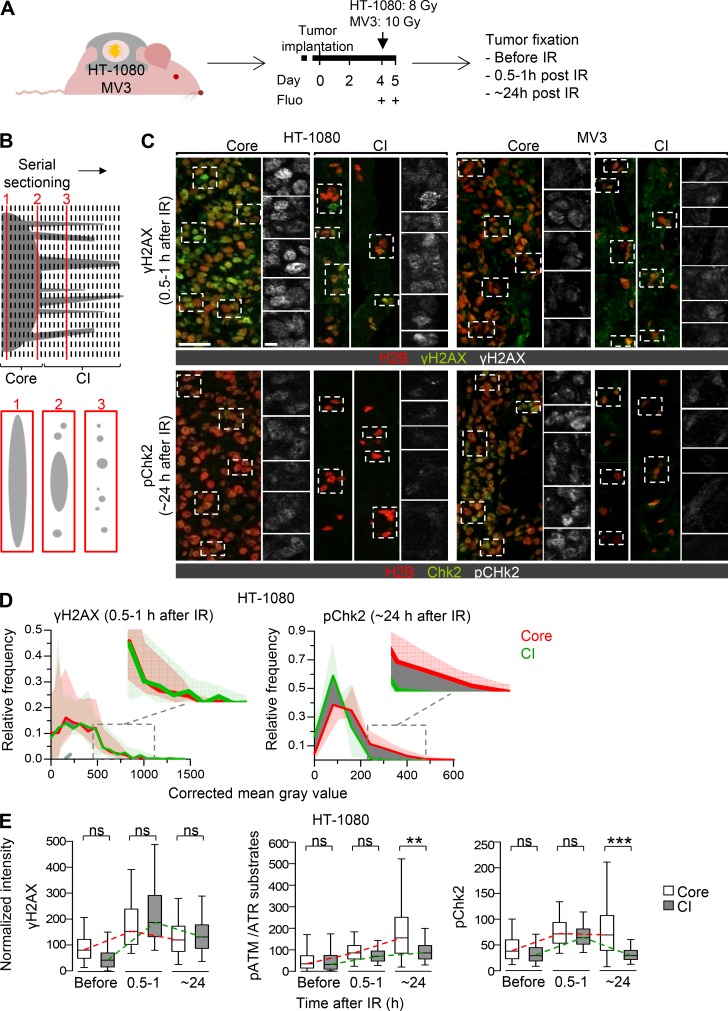
Figure 3.
Differential DDR in tumor core and collective invasion niche. (A) Experimental procedure for tumor sample collection to analyze the DDR. Fluo, epifluorescence overview microscopy. (B) Strategy for differential immunohistological analysis of DDR in tumor core and collective invasion (CI) zone. Upper panel, serial sectioning of the entire tumor; lower panels, resulting cross-sectioned patterns. (C) γH2AX and pChk2 signal in tumor core and collective invasion zone detected at early (≤1 h) and late (24 h) time point after a single-dose IR. Maximum-intensity projections from confocal 3D stacks. Dashed rectangles indicate representative tumor nuclei for single-channel display of γH2AX or pChk2 signal. H2B, H2B-EGFP (tumor nuclei). Images were chosen to show the variation of the intensity and subcellular structure of positive events. Scale bars, 50 µm (overview); 25 µm (inset). Examples for nonirradiated samples are shown in Fig. S3 E. (D) Intensity distribution of DDR signals in HT-1080 tumors after a single-dose IR. Data show the mean gray value after background correction (lines) and signal range (filled areas, lowest to highest values) from three independent tumors. Dark gray shaded area, difference between core and collective invasion zone. (E) Quantification of γH2AX, pATM/ATR substrates, and pChk2 signal intensity after single-dose IR. Data represent the median gray value per nucleus after background correction, with 25th/75th (box) and 5th/95th percentiles (whiskers) from three independent tumors. ∼150–600 nuclei per invasion zone and tumor and ∼1,000–6,000 representative nuclei per core and tumor were analyzed. Dashed lines visualize approximate dynamics of DDR. **, P = 0.003; ***, P < 0.0001. Statistics, mixed-model ANOVA (see Materials and methods for details).

