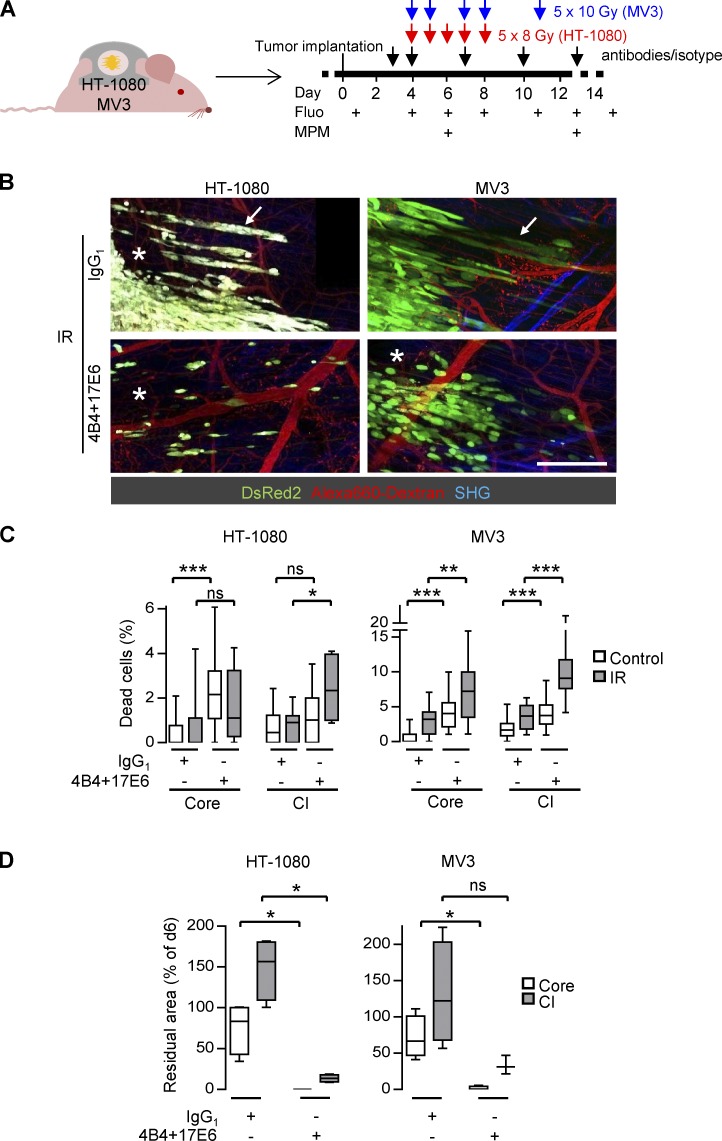
Figure 6.
Dual-integrin targeting abrogates radioresistance in the collective invasion niche. (A) Protocol for administration of anti-β1 (4B4) and αV integrin (17E6) mAbs or IgG1 combined with fractionated IR and sequential intravital imaging of the tumor response. Fluo, epifluorescence overview microscopy. MPM, subcellular-resolved multiphoton microscopy. (B) Radiation response of tumor core and collective invasion zone after combined treatment with mAbs 4B4 and 17E6 compared with IgG1-treated control (day 13). Black box in upper right corner (HT-1080, IgG1) results from stitching of adjacent images without complete overlap. Asterisks, areas of regression. Arrows, persisting invasion strands. Alexa Fluor 660–conjugated dextran-perfused blood vessels. Second harmonic generation (SHG) originates from muscle and collagen fibers. Scale bar, 250 µm. (C) Frequency of dead cells in core and collective invasion (CI) zone after antibody-based integrin targeting and/or IR (day 6). Data show the medians, 25th/75th percentiles (box), and 5th/95th percentiles (whiskers) of ∼20 nuclei per condition and tumor regions from four to five tumors, reflecting a total of 9–28 different microscopic fields. *, P = 0.01; **, P = 0.001; ***, P < 0.0001; ns, not significant. Statistics, Mann–Whitney U test (Bonferroni-corrected threshold: P = 0.0125). (D) Extent of tumor regression in core and collective invasion zone of irradiated tumors combined with or without integrin targeting. Data show median residual areas, 25th/75th percentiles (box), and 5th/95th percentiles (whiskers) of day 13 normalized to day 6 from four independent tumors. *, P = 0.03. Statistics, Mann–Whitney U test.

