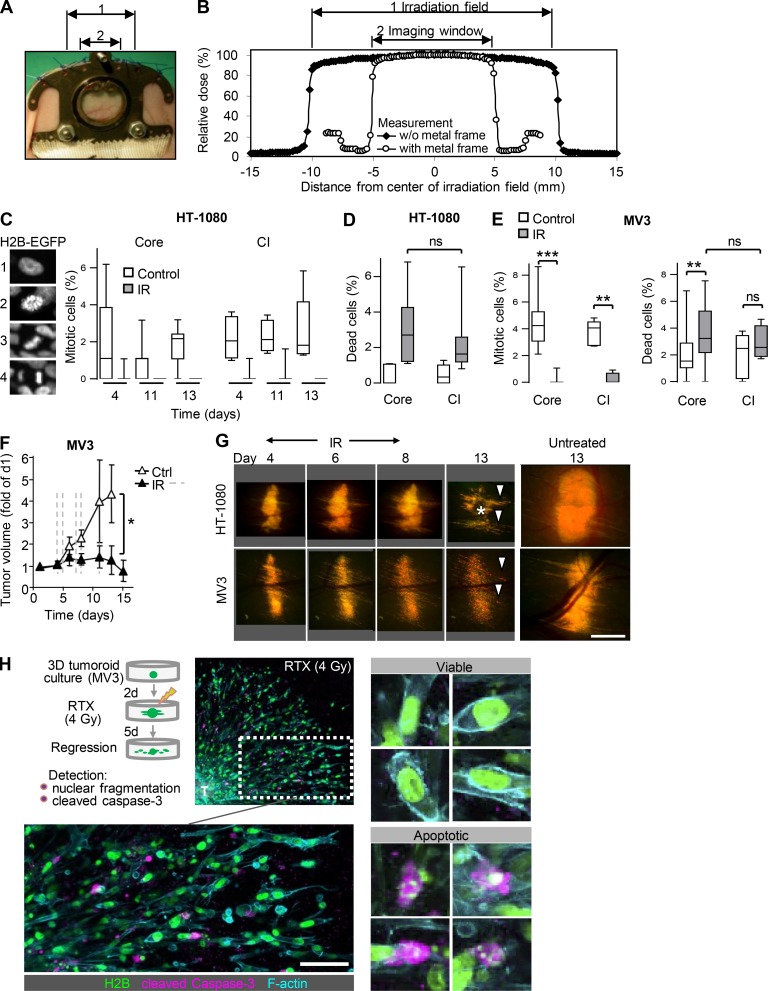
Figure S2.
Workflow and quantitative analysis of the radiation response of sarcoma and melanoma tumor subregions monitored by intravital microscopy. (A and B) Dimensions and uniform dosing of IR across the visible field of the skin window using focal-beam IR (2-cm beam diameter). (A) Topography of the IR field (1) and skin window (2). (B) Dosimetry of IR measured across the IR field (1). Due to the metal frame of the imaging window, only the window itself (2) is exposed to IR. (C) Frequency of mitotic planes in HT-1080 tumor core and collective invasion strands, by scoring the H2B-EGFP pattern (1, interphase nucleus; 2–4, mitotic nuclei [2, prometaphase; 3, metaphase; 4, anaphase]). Data show the median fraction, 25th/75th percentiles (box), and 5th/95th percentiles (whiskers) from 5–20 different microscopic fields representing three to four tumors. Per tumor region and day, 10–20 nuclei were analyzed. (D) Frequency of dead cells in HT-1080 tumor cores and collective invasion strands (pooled data days 11 and 13). Data represent the medians, 25th/75th percentiles (box), and 5th/95th percentiles (whiskers) of ∼80 nuclei per tumor region from 5–20 fields/tumor from three to four independent mice. Statistics, Mann–Whitney U test. (E) Frequency of mitotic and dead cells in tumor core or collective invasion (CI) zone of MV3 tumors (day 6). Data show the median fraction, 25th/75th percentiles (box), and 5th/95th percentiles (whiskers) of 10–20 nuclei per tumor region from 9–28 different microscopic fields representing four to five tumors. **, P = 0.004 (mitotic cells) or P = 0.002 (dead cells); ***, P < 0.0001; ns, not significant. Statistics, Mann–Whitney U test. (F) MV3 tumor growth before, during (dashed lines; 5 × 10 Gy), and after IR, compared with untreated tumors in independent mice. Means ± SD (four to seven independent tumors). *, P < 0.01 (difference between irradiated and control tumors at the endpoint [day 13]). Statistics, Mann–Whitney U test. (G) Time course of radiation response in representative lesions, compared with nonirradiated control tumors (day 13, images derived from Fig. S1 A). Arrowheads, invasion zone. Asterisks, regression zone. Scale bar, 1 mm. (H) MV3 tumoroids invading into a 3D collagen matrix were subjected to a single dose of IR (RTX, 4 Gy) and analyzed 5 d later for both fragmentation of the nucleus and cleaved caspase-3 as transient apoptosis marker. Upper panel, experimental setup and overview image showing tumoroid core (T) and invading cells with closeup of invasion zone. Lower panel, clear distinction of viable and apoptotic cells based on nuclear morphology and cleaved caspase-3 staining. Scale bar, 50 µm.

