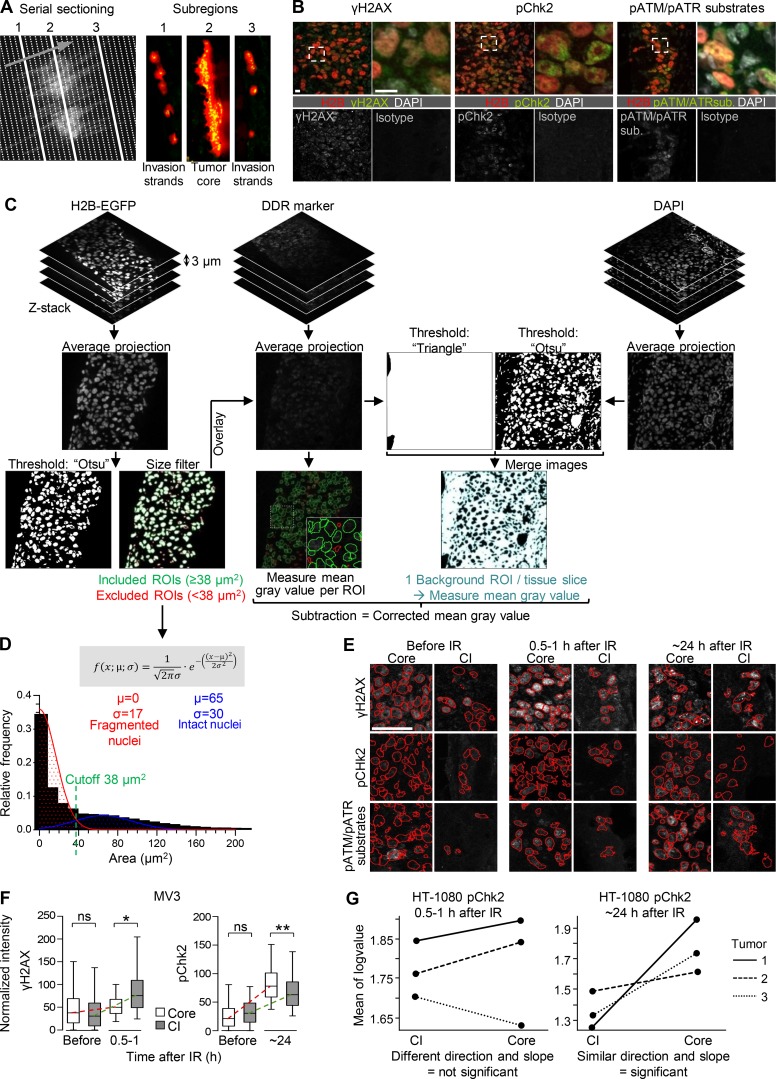
Figure S3.
Tumor subregion analysis of the DDR by serial sectioning and image analysis. (A) Principle of serial vertical tumor sectioning and morphology mapping to annotate serial samples from tumor core (region 2) and invasion zone (regions 1 and 3). Arrow, direction of sectioning. (B) Specific and isotype-controlled background staining for DDR markers (irradiated samples). Dashed rectangles, region of detail images. Scale bar, 10 µm. (C) Workflow for image segmentation and single-cell analysis. ROI, region of interest. (D) Histogram analysis of nuclear size distribution to determine the cutoff for exclusion of nuclear fragments (i.e., apoptotic nuclei). Indicated variables and formula were used for Gaussian distribution fitting to define the intersection and separate fragmented from intact nuclei. Area binning of ∼18,000 nuclear ROIs from three independent HT-1080 tumors including cores and invasion zones. Similar distributions and curves were obtained for MV3 tumors resulting in the same cutoff (data not shown). (E) Representative γH2AX, pChk2, and pATM/ATR substrate signal in subregions of HT-1080 tumors before, shortly after, or 1 d after single-dose IR. Representative maximum-intensity projections from confocal 3D stacks. Red selections, ROIs of tumor nuclei. CI, collective invasion. Scale bar, 50 µm. (F) Quantification of γH2AX and pChk2 signal intensity in MV3 tumors before and after single-dose IR. Data originate from ∼150–600 nuclei per invasion zone and tumor and ∼1,000–6,000 nuclei per core and tumor from two independent tumors, represented as medians, 25th/75th percentiles (box), and 5th/95th percentiles (whiskers). Dashed lines visualize approximate dynamics of DDR. *, P = 0.01; **, P = 0.003; ns, not significant. Statistics, mixed-model ANOVA (see Materials and methods for details). (G) Identification of biologically relevant effects from large datasets. Example plots derived from the Imer function after performing a mixed-model ANOVA showing the distribution of mean of log values for different tumor subregions and tumors. Only datasets revealing similar directions and slopes were included for statistical analysis (right plot), whereas samples with disparate or noise-like behaviors (left plot) were considered not significant.

