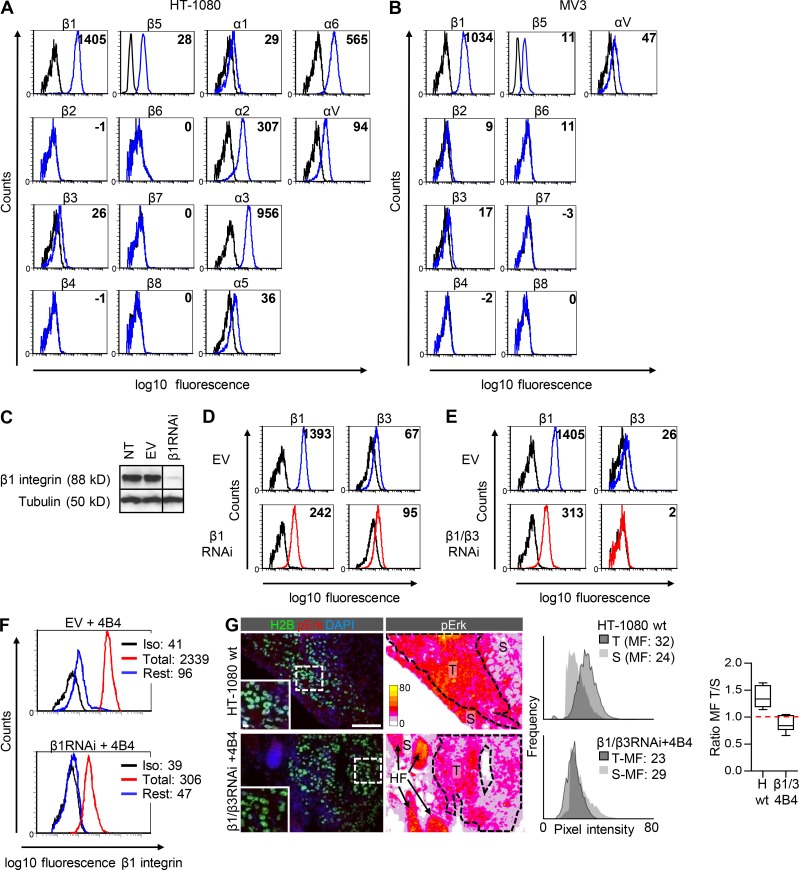
Figure S4.
Integrin expression profiles in HT-1080 and MV3 cells and RNAi-based integrin targeting in HT-1080 cells. (A and B) Surface expression pattern of integrin β and α chains on HT-1080 (A) and β chains on MV3 (B) cells determined by flow cytometry. Black line, isotype control. Values, mean fluorescence (minus isotype values). (C–E) Downregulation of β1 and β3 integrins in HT-1080 cells by shRNA. (C) Knockdown efficiency of β1 integrin in dual-color HT-1080 cells (Western blot), compared with nontransduced (NT) and empty vector (EV)–transduced cells. β-Tubulin, loading control. (D and E) Upregulation of β3 integrins after downregulation of β1 integrin (D) and efficient downregulation of both β1 and β3 integrins after β1/β3RNAi (E) determined by flow cytometry. Surface expression pattern of β1 and β3 integrins on β1RNAi cells or β1/β3RNAi cells (red lines) compared with cells transfected with empty vector (EV, blue lines). Black line, isotype control. Values, mean fluorescence (minus isotype values). Stability of β1/β3 downregulation was routinely verified, and no outlier behavior or drift of expression to other integrin β-chains was noted (data not shown). (F) Reduction of β1 integrin adhesion epitope detected by FITC-conjugated mAb 4B4 on vector control (EV; left) and β1RNAi cells (right) after epitope saturation with unconjugated mAb 4B4 (3 µg/ml; blue line showing residual epitopes) compared with unspecific IgG1 (red line; total epitopes). Black line, isotype control staining (Iso). Values indicate mean fluorescence intensities. (G) Diminished phosphoErk signal (MAPK signaling) after β1/β3 integrin targeting (day 7). Histograms show the mean pixel fluorescence (MF) intensity of pErk from control (HT-1080 wild type) and β1/β3 integrin targeted tumors (T, dotted lines, identified by H2B-EGFP label) compared with pErk signal in the surrounding stroma (S), which further contained hair follicles (HF) with strong endogenous pErk expression. Ratio of tumor- and stroma-derived pErk intensity is displayed as medians, 25th/75th percentiles (box), and 5th/95th percentiles (whiskers) from one sample determined from 10 independent regions of the corresponding stroma region after exclusion of hair follicles, with a ratio of 1.0 (red dashed line) when signal intensity of both regions was equal. Calibration bar, pixel intensity. Scale bars, 100 µm (overview); 10 µm (inset).

