Figure S5.
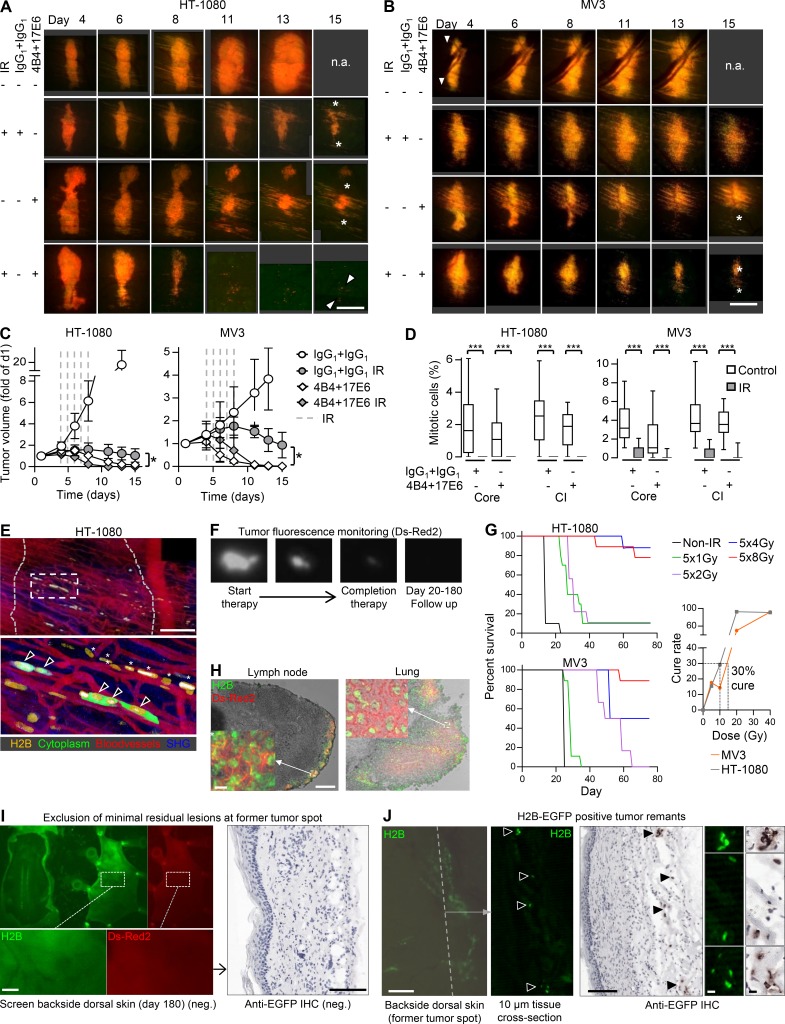
Radiosensitization of sarcoma and melanoma tumors by antibody-based integrin interference and procedures and outcome of long-term therapy response. (A–D) Tumor morphology and quantification of radiosensitization assessed by intravital microscopy. (A and B) Time-dependent growth or regression of HT-1080 or MV3 lesions in response to the indicated treatment conditions. n.a., not analyzed due to humane endpoint after day 13 (tumor >2 cm3). Images of untreated HT-1080 and MV3 tumors are also shown in Fig. S1 A. Asterisks, regression tumor core. Arrowheads, tumor remnants. Scale bars, 1 mm. (C) Time-dependent tumor volume during and after treatment with IgG1 or mAb 4B4 + 17E6 with or without IR. Data show the means ± SD from three to four (HT-1080) or three to five (MV3) independent lesions. *, P = 0.0286 (comparison IgG1/IR control with 4B4/17E6 and IR [day 15]). Statistics, Mann–Whitney U test. (D) Mitotic frequencies in nonirradiated and irradiated tumor core and collective invasion (CI) zone. Data show the medians, 25th/75th percentiles (box), and 5th/95th percentiles (whiskers) of 10–20 nuclei per tumor region and condition from 7 to 23 independent fields from four (HT-1080) or three to five (MV3) independent tumors. ***, P < 0.0001. Statistics, Mann–Whitney U test. (E) Long-term follow-up (day 26) after treatment with 4B4 and 17E6 and IR, revealing minimal residual disease. Dotted gray line, position of former tumor. Box, position of lower panel. Zoom shows surviving cells without mitotic activity (arrowheads) and cytoplasm-free, condensed nuclei of disintegrated cells (asterisks). Scale bars, 250 µm. (F) Example tumor undergoing complete regression after therapy monitored longitudinally by whole-body fluorescence imaging. (G) IR dose escalation study for intradermal HT-1080 and MV3 tumors (window-free dermis). Left panels, overall survival after IR using the indicated doses (6–10 mice per group). Right panel, cure rate measured as percentage of tumors that did not relapse after IR. Black dashed line, IR dose with 30% cure rate (5 × 2 Gy for HT-1080 tumors, 5 × 3 Gy for MV3 tumors). (H) Dual-color detection of lung and lymph node metastases. Microscopic whole-organ screen (not depicted) was followed by analysis of cryosections (depicted). Scale bars, 100 µm (overview); 10 µm (inset). (I) Identification of minimal residual disease at the endpoint. The dorsal skin was screened from the deep fascia for presence or absence of fluorescent tumor remnants (left panel). In case of doubt, subregions were additionally sectioned for analysis by anti-EGFP immunohistochemistry (IHC; right panel). Images show typical tumor-negative outcome. Scale bar, 100 µm. (J) Examples of minimal residual lesions present at the tumor implantation site at the endpoint (day 180). Tumor remnants with strand-like pattern of green-fluorescent tumor nuclei (H2B-EGFP) followed by tissue sectioning and validation by anti-EGFP IHC. Dashed line, approximate position of tissue cross section. Arrowheads, intact H2B-EGFP–positive tumor nuclei. Right panel, validation of EGFP-positive tumor remnants and positive anti-EGFP IHC side by side. Scale bars, 100 µm (overview); 10 µm (details).

