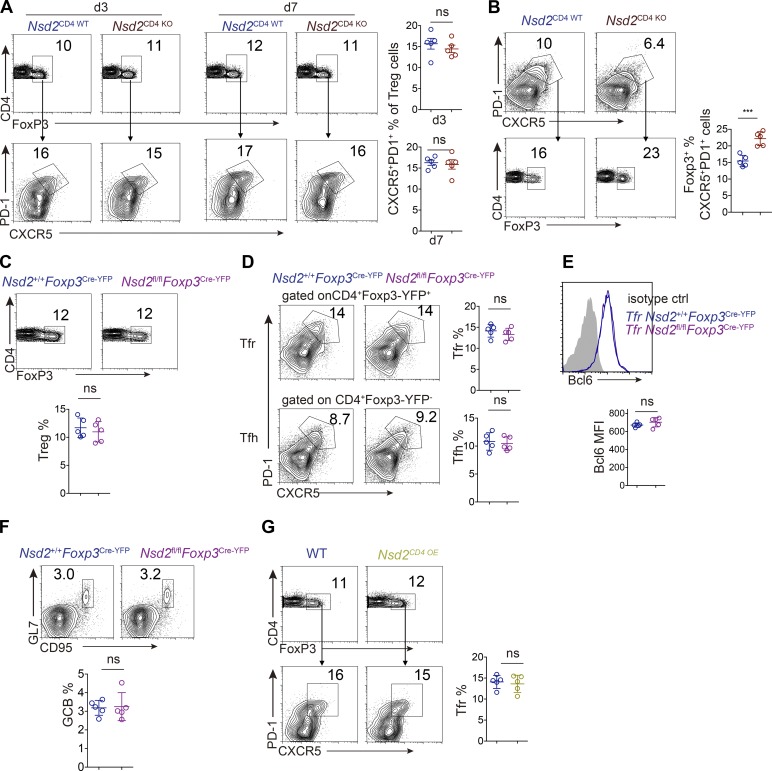
Figure S2.
Tfr cell differentiation analysis. (A and B) Tfr analysis by flow cytometry with splenocytes from SRBC immunized Nsd2CD4WT and NSD2CD4KO mice at day 7. (C–F) Analysis of T reg cell (C), Tfr and Tfh (D), and Bcl6 expression (E) and GC B cell response (F) in Nsd2+/+ Foxp3Cre-YFP, and Nsd2fl/fl Foxp3Cre-YFP mice immunized with SRBC for 7 d. (G) Analysis of Tfr cells in Nsd2 OE mice at day 7 after SRBC immunization. Data are all representative of more than three experiments. In all bar graphs, bars represent means, and dots represent individual mice. Error bars show means ± SD. Statistical analysis was done with Student’s t test. ns, not significant; ***, P < 0.001.

